
In my previous post about reading thermistors with a Wemos D1 Mini, I observed resulting output seemed a bit high at lower temperatures, while readings were lower compared to other sensors at higher temperatures. (If you haven’t read that post yet, you may want to check that first in order to understand the starting point of this post.) As I had discovered, the problem was in part due to variable input voltage. Even after fixing that issue, there were a few tenths of a degree unaccounted for. I theorized this could have something to do the precision of the thermistor itself or perhaps the way the result was calculated. My plan was to test both theories.
In the mean time I received a more accurate thermistor (0.2% in stead of 1%). As a side note, it is not only more precise, but in stead of a steel probe the thermistor is housed in nothing but a small epoxy layer. This is the datasheet. Because it has a different housing, I would not be surprised if the overall behavior of the sensor is slightly different. I am mostly thinking about response times.
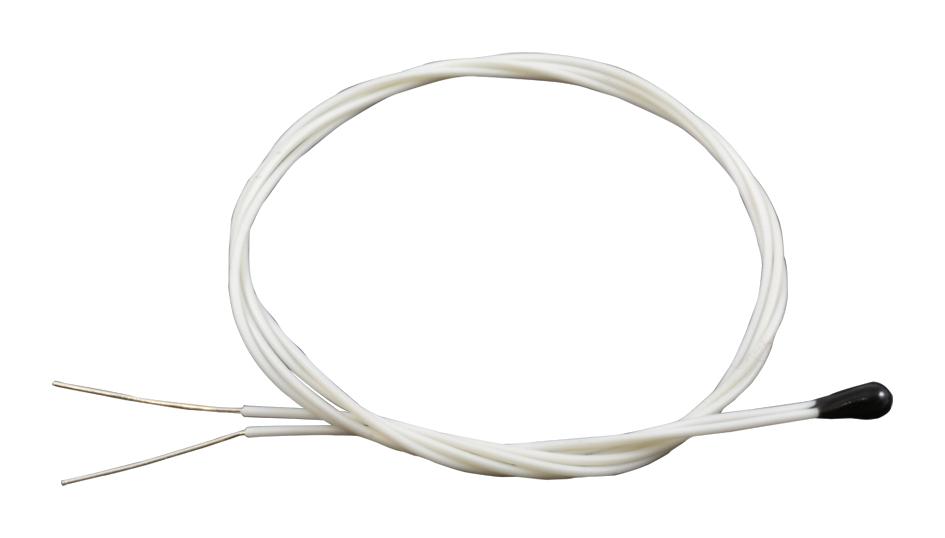
The 30 AWG wire of this thermistor is only 20 centimeters long, so it needs to be extended. I used this 0.08 mm² wire, which (at 28 AWG) is only slightly thicker than the thermistor wiring. Soldering them together was relatively easy that way.
My tests with this new sensor inside my actively ventilated Apogee TS-100 radiation shield showed roughly similar results as before. Night time temperatures were a bit higher than my reference PT100 sensor. The thermistor and PT100 readings start to overlap roughly between 18 and 22 degrees. After that, the thermistor reads lower in this data set. Up to about 2-tenths at 26 degrees.
Quick conclusion: since both the previously tested thermistor and this new one show the same undesired behavior, the issue is likely not the thermistor itself.
The next logical step is looking at my code. Perhaps the way I calculate the temperature based on the measured resistance leaves something to be desired. For the setup that produced these charts above, I used most of the example code from the Adafruit tutorial. It uses the “simplified B parameter equation” to derive temperature from resistance. It explains that this equation is an alternative to the Steinhart-Hart equation (or just simply Steinhart equation). As it turns out, the B parameter equation is an approximation, but not a terribly good one. Before we get into why the Steinhart equation is a much better way to calculate temperature, let’s take a look at it.
Besides R, the resistance value of the thermistor, we need three other values: A, B and C. These are called the ‘Steinhart coefficients’.
In order to get these coefficients, we need some more information about our thermistor. Specifically, we require a lookup table for our thermistor, which gives us the resistance values at different temperatures. These values will allow us to calculate the three coefficients needed as input for the equation. Now I made sure the thermistor I am using has such an accompanying table, which can be found in the datasheet already mentioned.
This Wikipedia page explains how to get A, B and C from the lookup table. Easier is using websites like this one, which has a convenient calculator we can use. Three data pairs (temperature and resistance) are required, one for each coefficient. Using the minimum value, the value for 10K and the maximum value for the thermistor makes sense. Though I think entering values for a temperature range that better matches the expected values may make sense too (I am never going to measure anything above 50 degrees). Nevertheless, in my case I used the temperature values of -40 (min), 25 (@10K) and 125 (max) degrees. The calculator yields these values for the input supplied from the datasheet:
A = 0.001130407327
B = 0.0002339285378
C = 0.00000008837346307
On the web page, note the negative exponent values shown next to the actual values. (I did not notice these at first) A is given as 1.130395217E-3, meaning I need to move the decimal place three places to the left, which results in 0.001130407327.
Having calculated these coefficients, the web site also allows for a comparison between the result of the B parameter equation and the Steinhart equation. All we need for this is the correct B or Beta value for the thermistor. From the datasheet we read that for my thermistor this is 3976.
If I now pick the resistance value for 10 degrees from the table, which is 19903.41, and enter it into the resistance field of the model calculator, the Steinhart equation returns 10 degrees exactly. On the other hand, the B parameter equation gives 10.37 degrees. This is, in my opinion, a huge difference! If we look at the value for 28 degrees (8776.88 ohms), once again the Steinhart equation gives us 28 precisely. The B parameter equation is now slightly lower at 27.95. This pattern is exactly what I have been experiencing. It turns out that the effect is not the same of the entire temperature range, though. At -20 degrees the difference is negative again, with the B parameter equation yielding -1.6 degrees compared to Steinhart. Up to a maximum of 40 degrees, the effect is limited, with only a 0,2 degree difference. This seems consistent with the graph shown below.
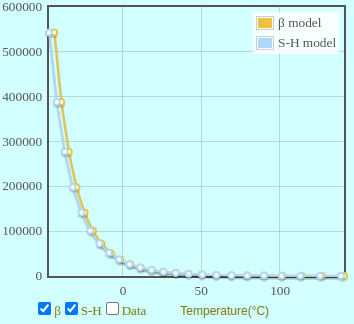
At temperatures below 0, both models diverge substantially, while at higher temperatures the difference appears (it’s a bit hard to see) acceptable but still resolves to as much as half a degree at different resistances. All this is more than enough reason to adjust my original code which uses the B parameter equation.
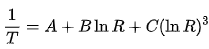
How do we change the code of my original post to include the Steinhart equation? The partial sketch I posted there in mind, we pick up after we have determined the resistance value. Assuming the coefficients are defined as A, B and C, the whole equation can be written like this.
double steinhart = 1 / (A + B * log(resistance) + C * pow(log(resistance), 3)) - 273.15;Note that 273.15 is subtracted from the result of the equation, because the result is temperature in Kelvin.
The complete partial sketch which I talked about in more detail then becomes:
double A = 0.001130407327
double B = 0.0002339285378
double C = 0.00000008837346307
//
int16_t adc = ads.readADC_SingleEnded(0); // read from A0
Serial.print("Raw adc: ");
Serial.println(adc);
float volts = ads.computeVolts(adc); // calculate voltage
Serial.print("Volts: ");
Serial.println(volts, 3);
float val = 3.3 / volts - 1;
float resistance = SERIESRESISTOR / val;
Serial.print("Thermistor resistance ");
Serial.println(resistance);
double steinhart = 1 / (A + B * log(resistance) + C * pow(log(resistance), 3)) - 273.15;
Serial.print("Temperature ");
Serial.print(steinhart);
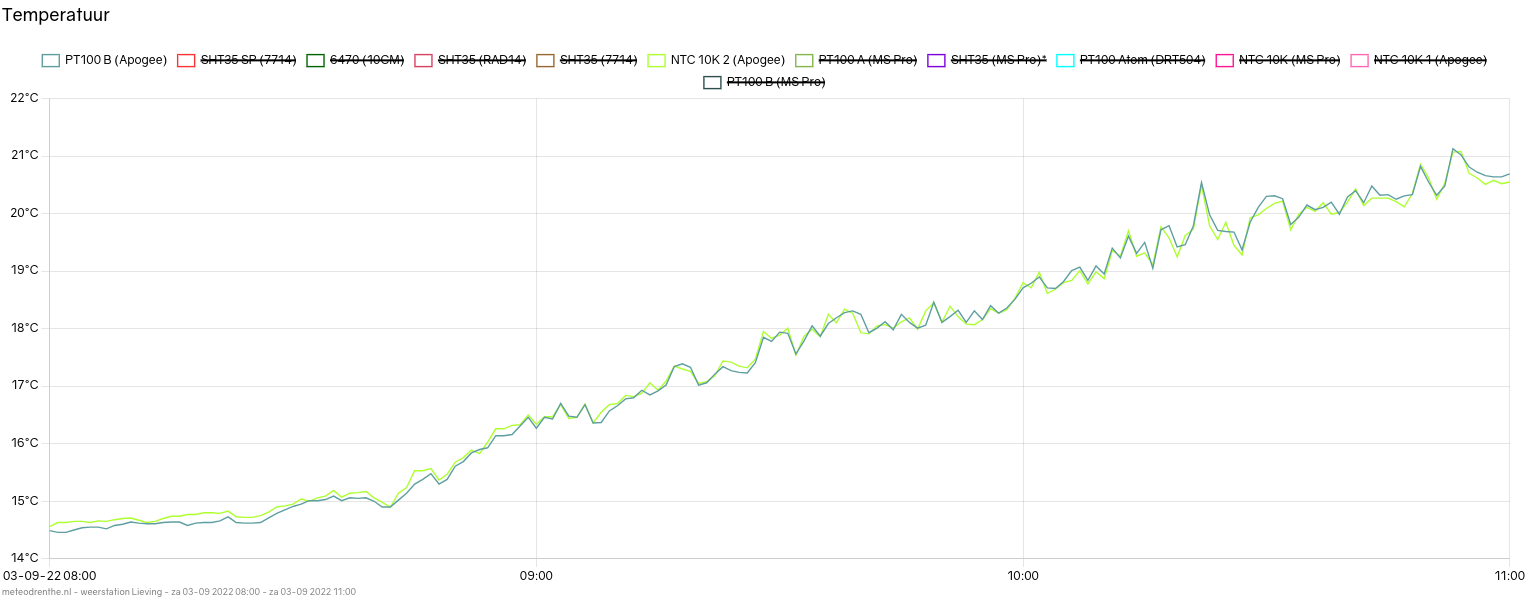
Serial.println(" *C");What is the actual effect on temperature readings? Below are some graphs for today. The difference between the minimum and maximum temperature is not huge (16 – 24), but it is sufficient for a first test. Three sensors are shown. First my reference PT100 in dark teal. Green is the thermistor still running the B parameter equation, while the orange line shows the temperature values calculated for the same thermistor sensor model but now using the Steinhart equation.
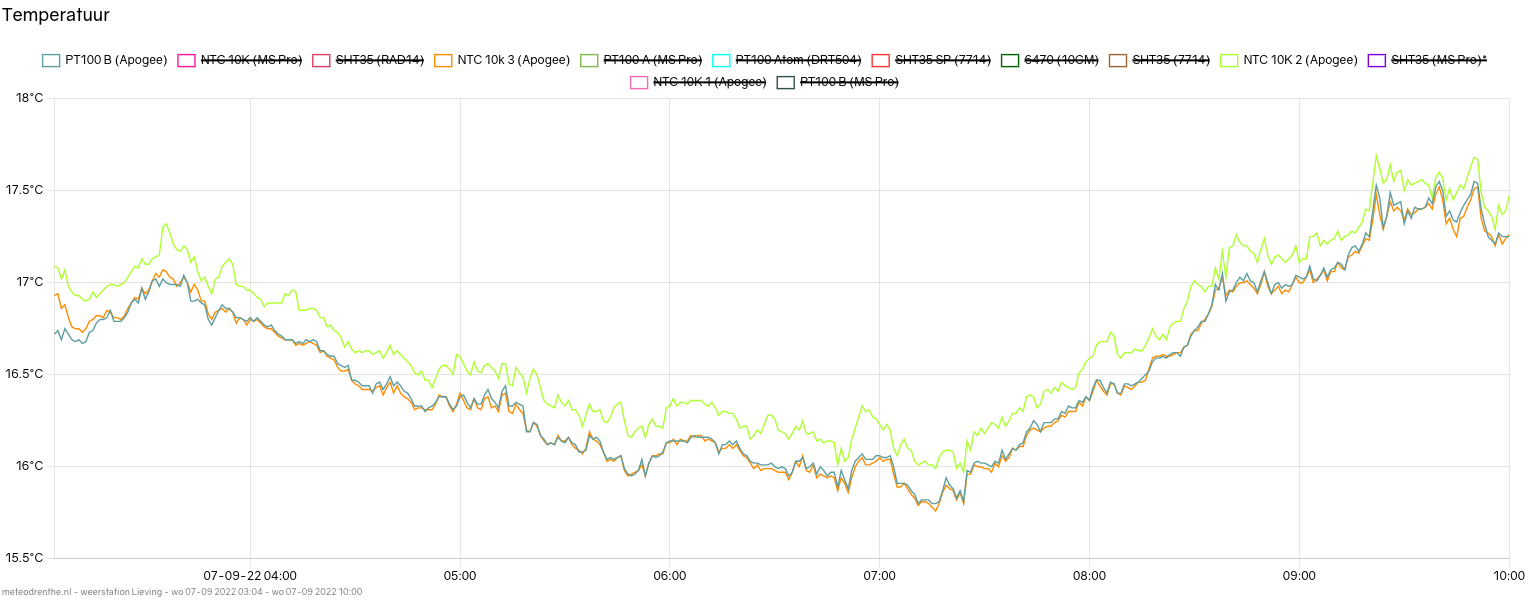
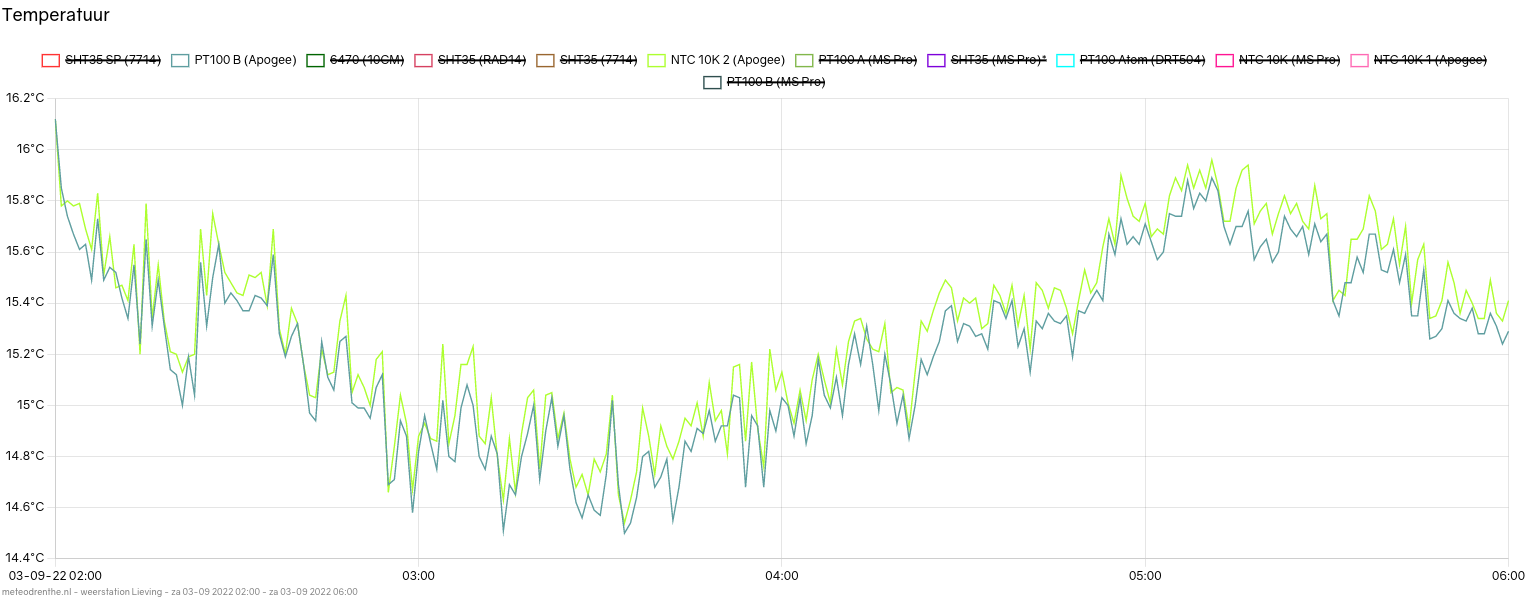
Above is the graph for 03:00 to 10:00. Clearly seen is the familiar behavior of the thermistor running the B parameter equation (green). Temperatures are higher than the PT100 reference. More clearly so than before even, probably because temperature is less jumpy this night. At the same time we can see this is not the case for the orange line, the thermistor running the Steinhart equation. It closely tracks the PT100.
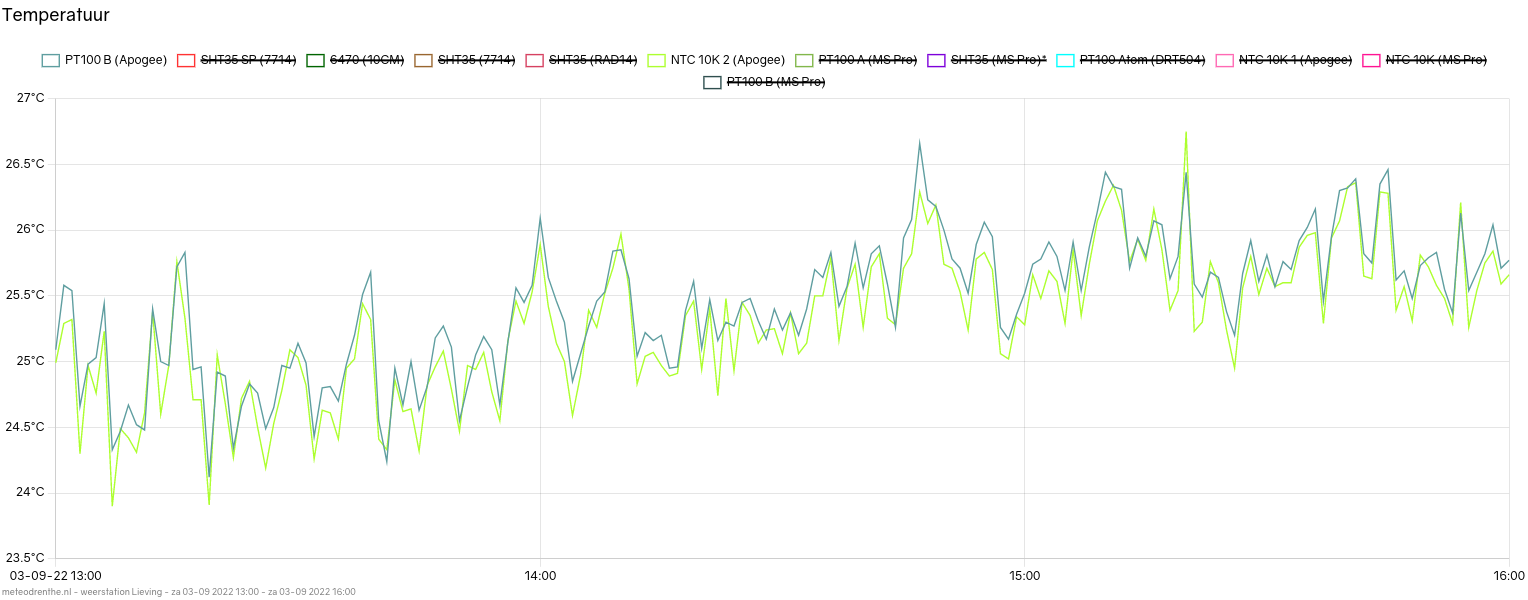
What of daytime temperatures? This is the graph for 12:00 to 16:00 on the same day.
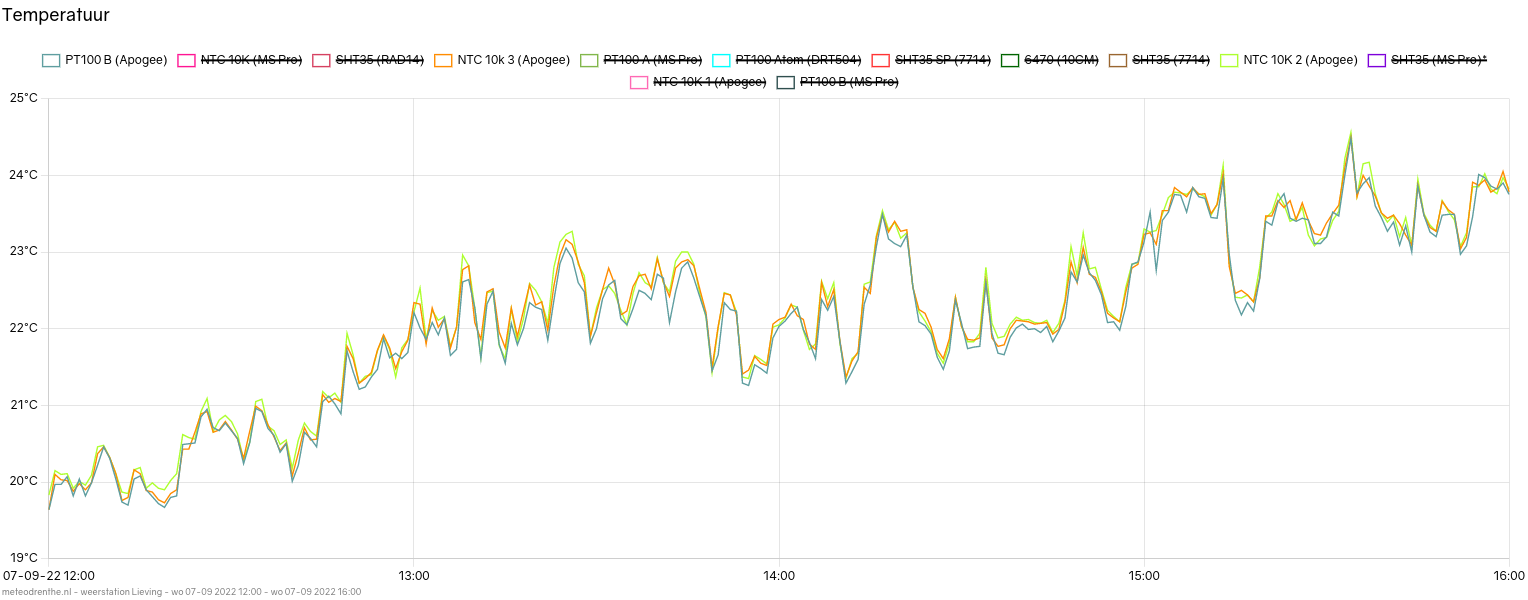
This graph is more erratic (as is usually the case when the sun is out), but we can see that the green line has one again joined the PT100. At the same time, we see no significant deviation of the orange line from the PT100. It would appear that, at least for this limited temperature range, the issue has been eliminated!
For the complete picture, here is all the data from 03:00 to 16:00 including a different thermistor model (in pink) which also uses the B parameter equation.
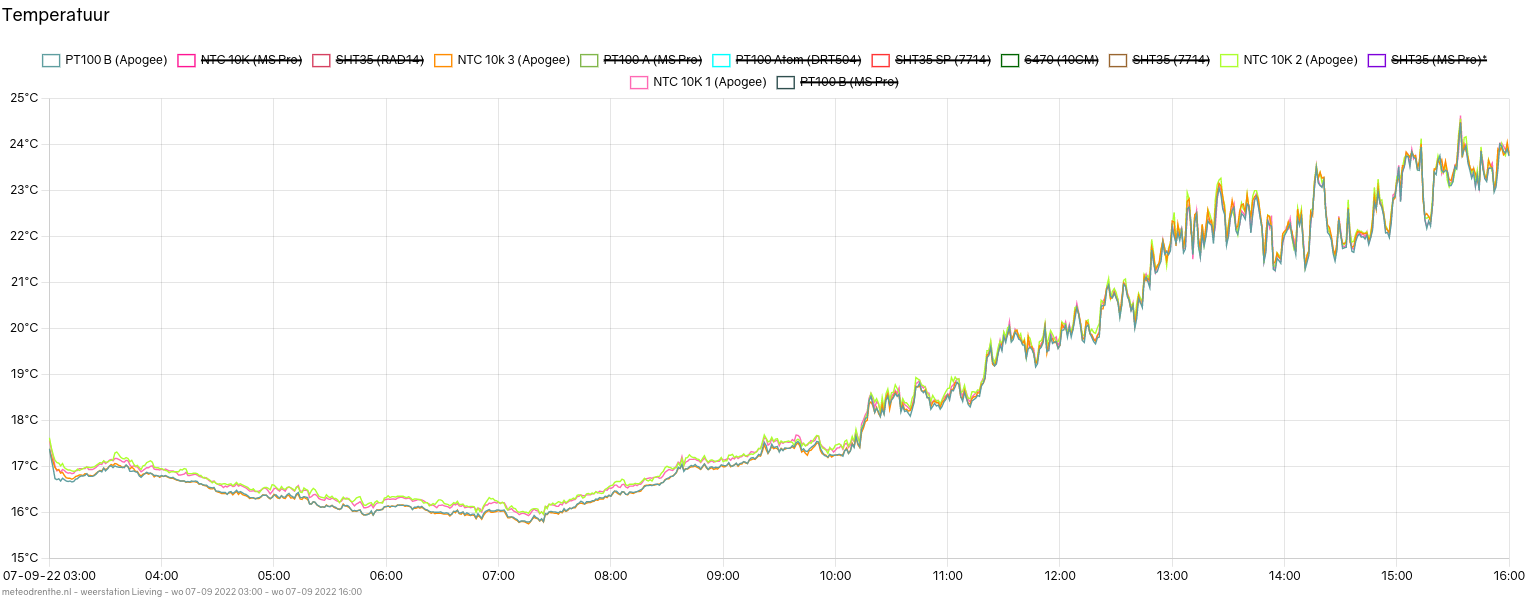
We can see that both the green and pink lines are about 0.2 degrees higher than the PT100 and Steinhart thermistor. That difference gets smaller as the morning progresses. At about 20 degrees, all sensors are in agreement again.
As has been seen before on colder nights, the B parameter equation will result in a difference increasing to 0.3. The Steinhart equation will have to prove itself along the way. Nevertheless, this limited test has shown that, if at all possible, one should absolutely prefer the Steinhart equation over the B parameter equation.