
It’s June. An ideal month in the Northern Hemisphere to observe the effectiveness of radiation shields under high solar radiation. Two of my main sensor setups are a passively ventilated Barani MeteoShield Pro with an SHT35 sensor and the actively ventilated Apogee TS-100 with PT100 sensor.
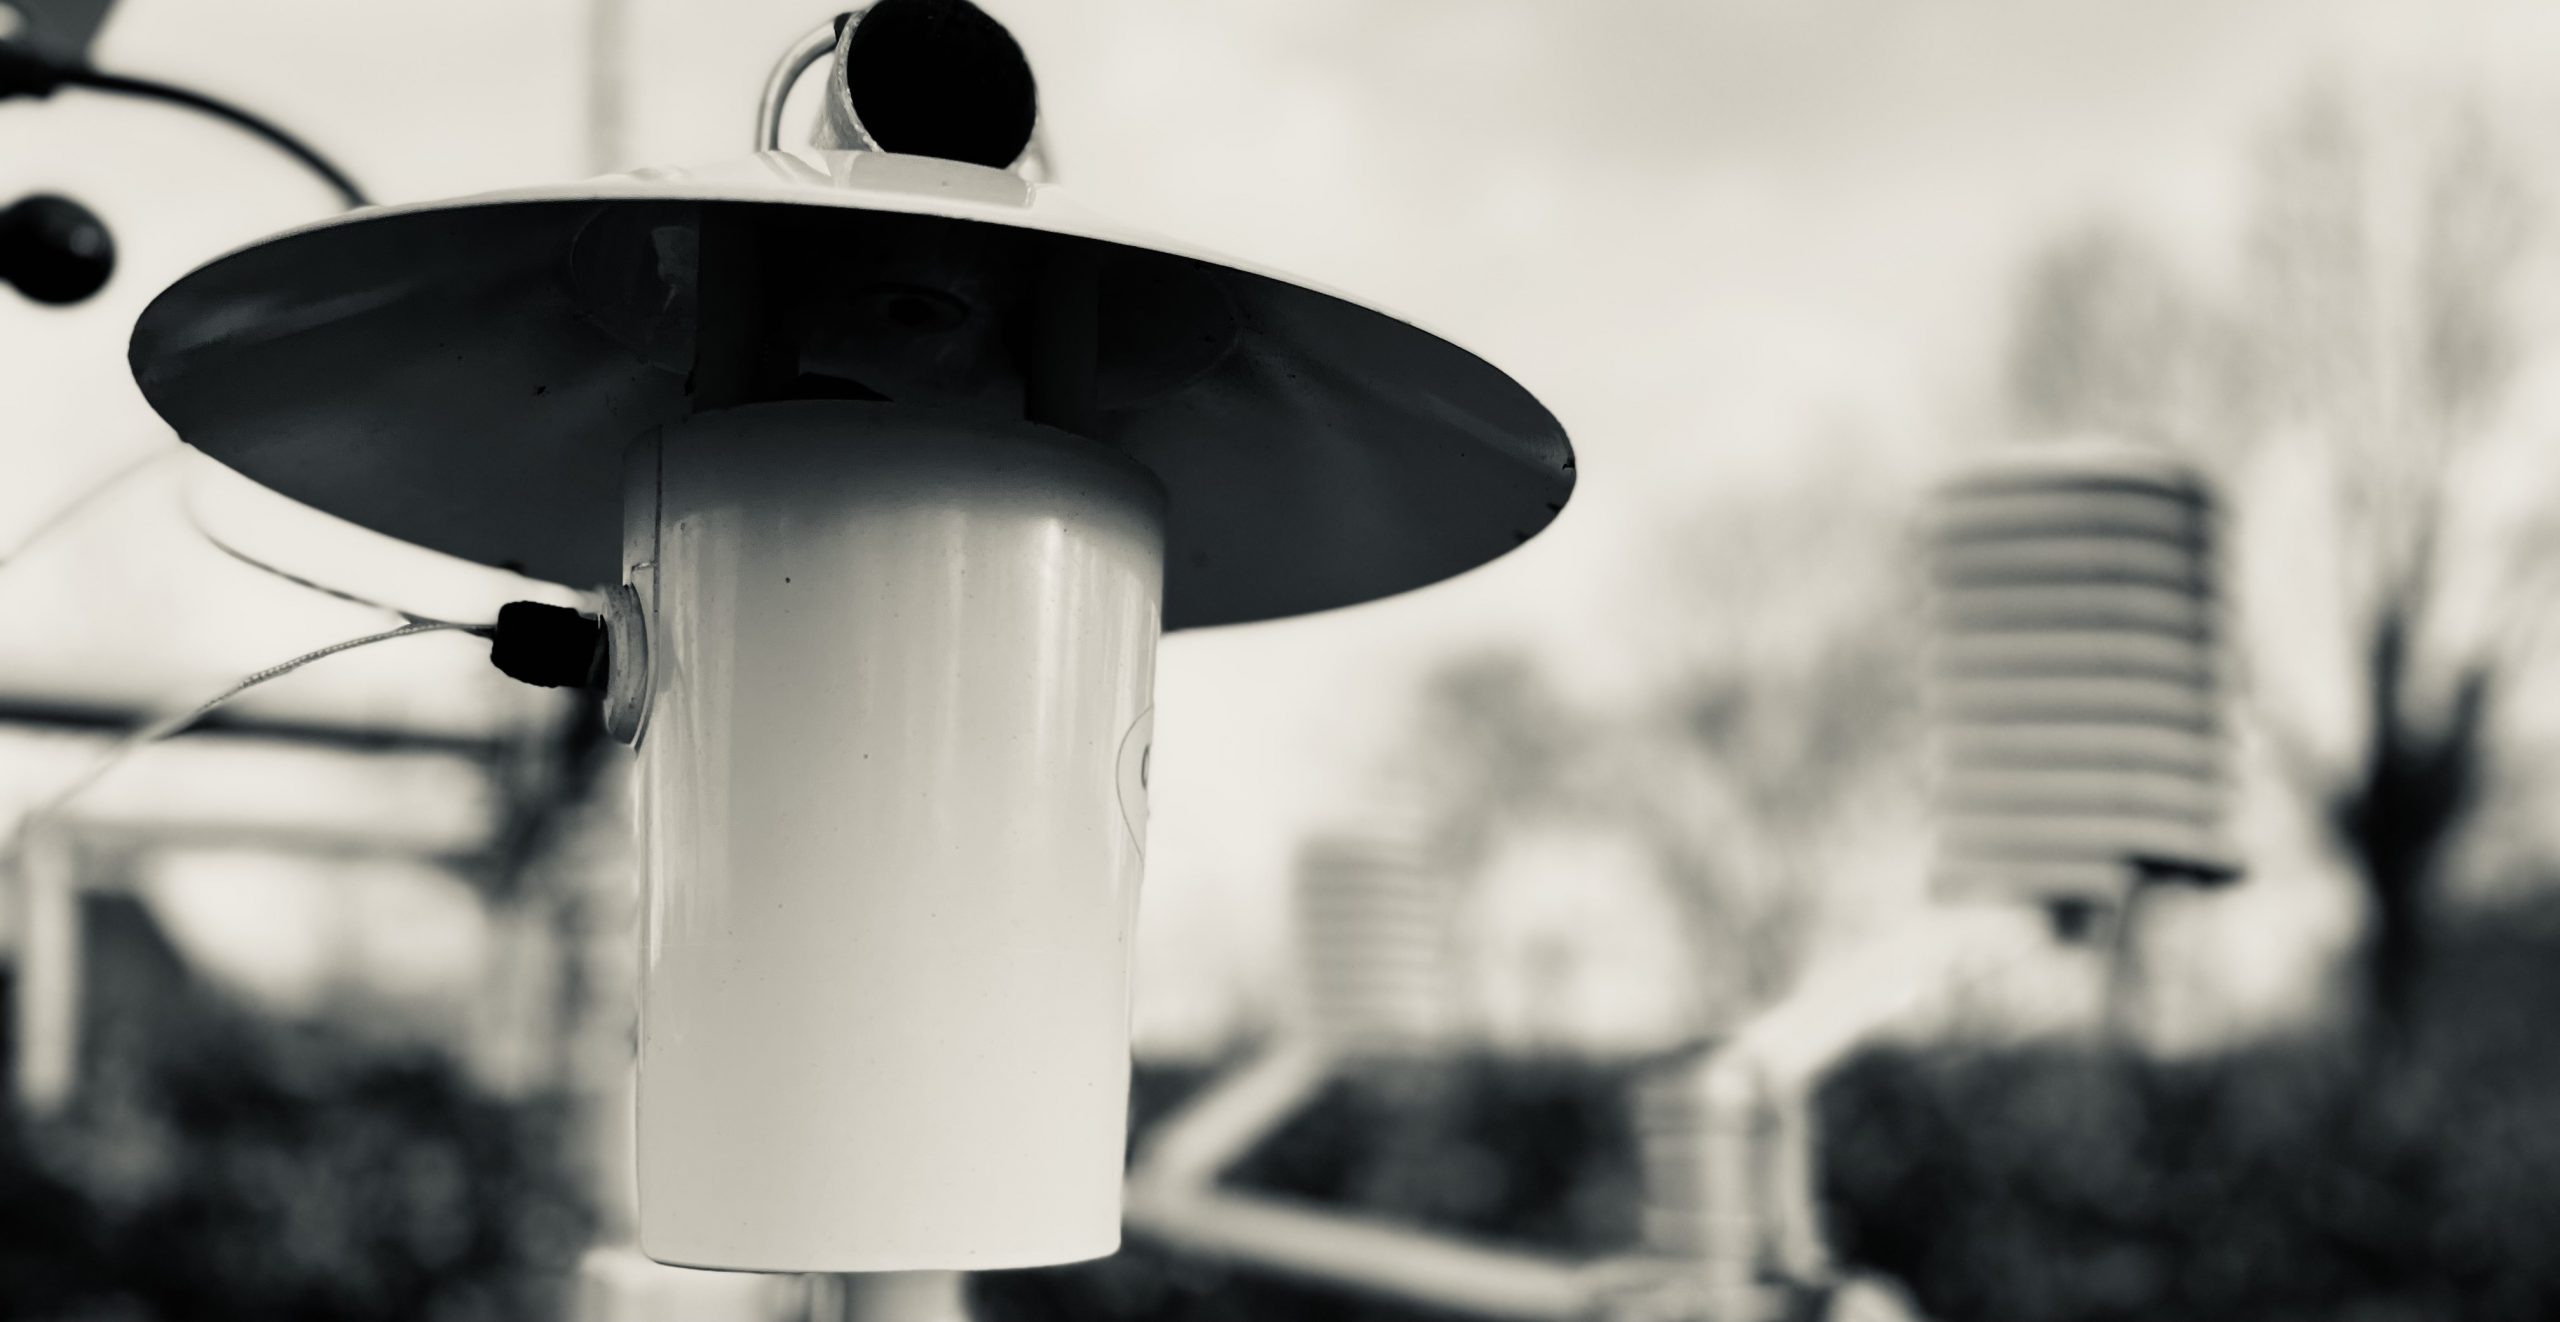
In theory, there should be situations where the Barani shield will suffer from circumstances and produce radiation errors. Specifically situations with high solar radiation combined with low or non-existent wind. In those cases the passive shield will heat up and receive little natural ventilation to keep the temperature inside the shield at or near ambient temperature. Then the shield with active ventilation will be at a clear advantage.
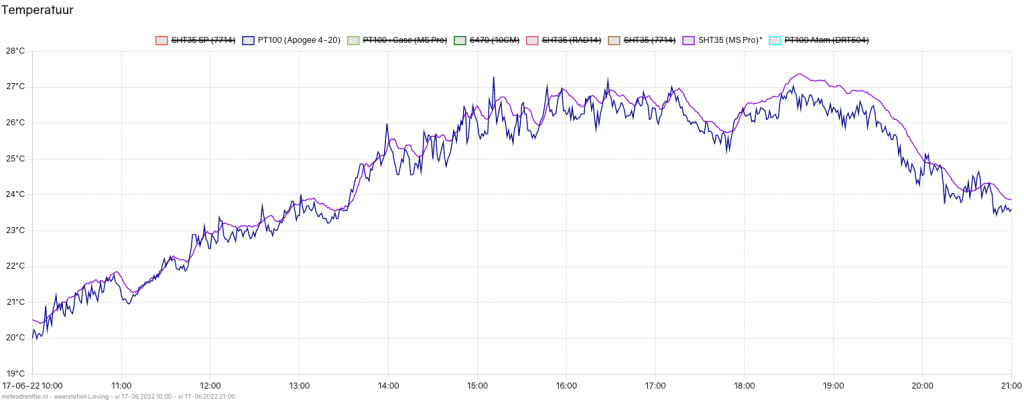
Surprisingly there are very few moments where this plays out during the year. Here is recent day which is fairly typical for most days of the year.
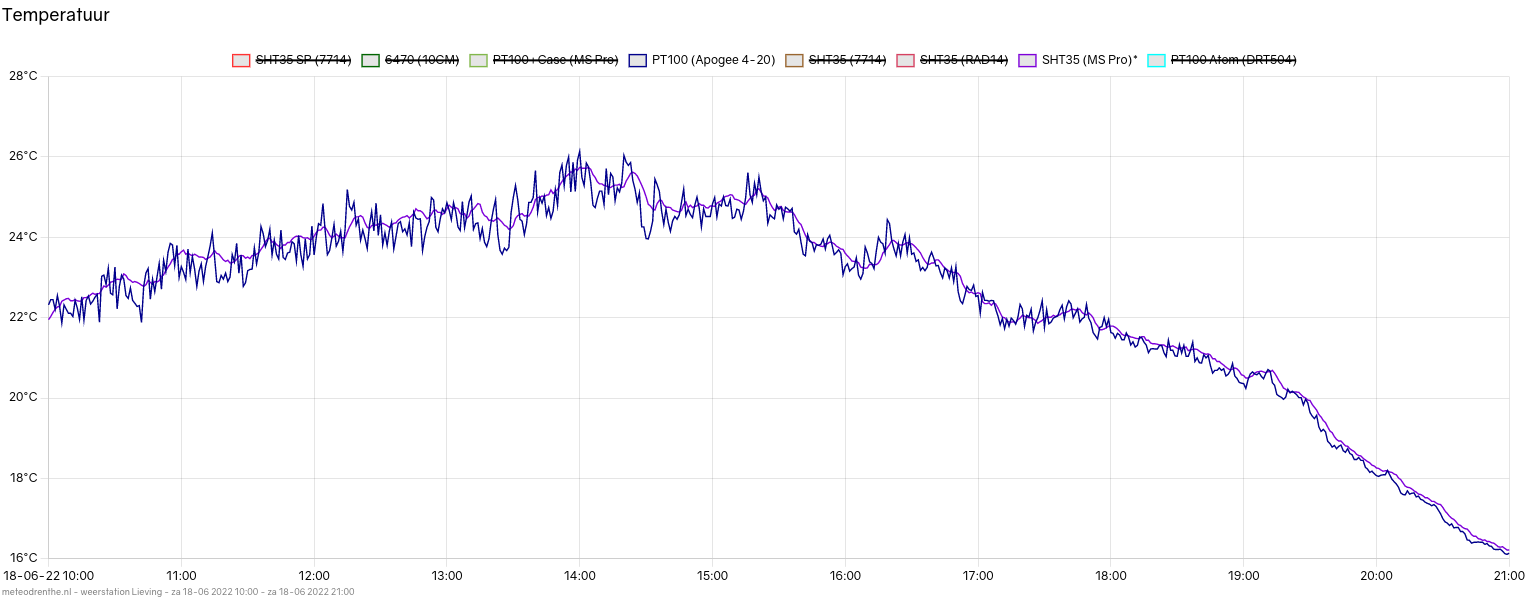
Even though this is June 18th, close to the summer solstice, the Barani (in purple) and Apogee shields perform similarly. Note that the sensors are of a different type. The PT100 has a faster response time. On average the two lines are nearly identical.
There are some days, however, when the downsides of a passive shield – even one as superb as the Barani MeteoShield Pro – become apparent.
Last Thursday, June 23rd, was the hottest day of the year to date. The temperature peaked at 31,5 degrees. It was a cloudless day, as apparent in this solar radiation graph.

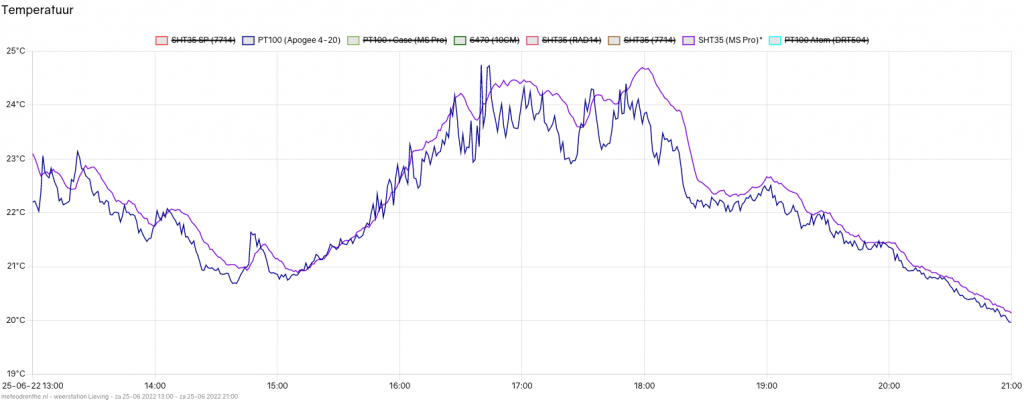
Now take a look at this temperature graph.
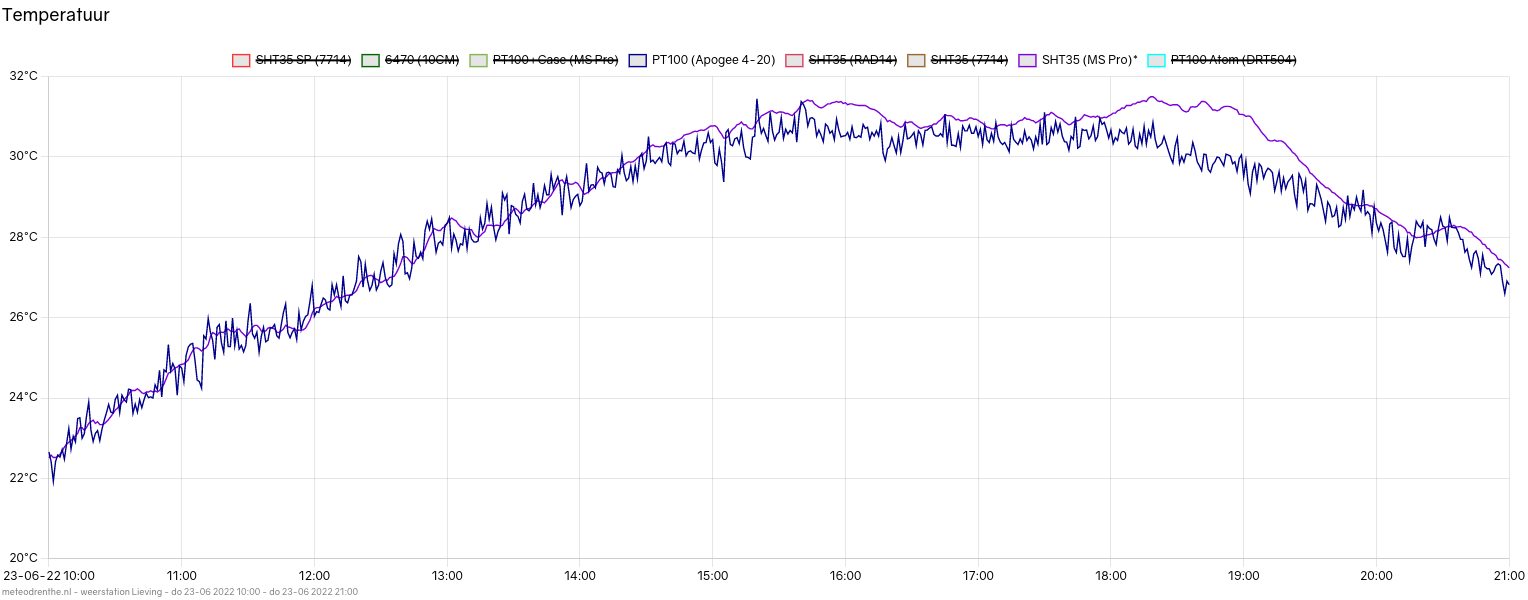
Until around 15:00 all seems well. Then the graphs start to deviate a bit. First for a short period between roughly 15:45 and 16:15, the Barani reads on average 0,6 degrees higher. The more painful period is between 18:00 and 19:30. While the Apogee shows slow cooling, the Barani climbs to reach values similar to the daily maximum. Towards 19:00 the difference between the two graphs peaks around 1,3 degrees. Afterwards the two graphs start converging slowly again.
So what happened?
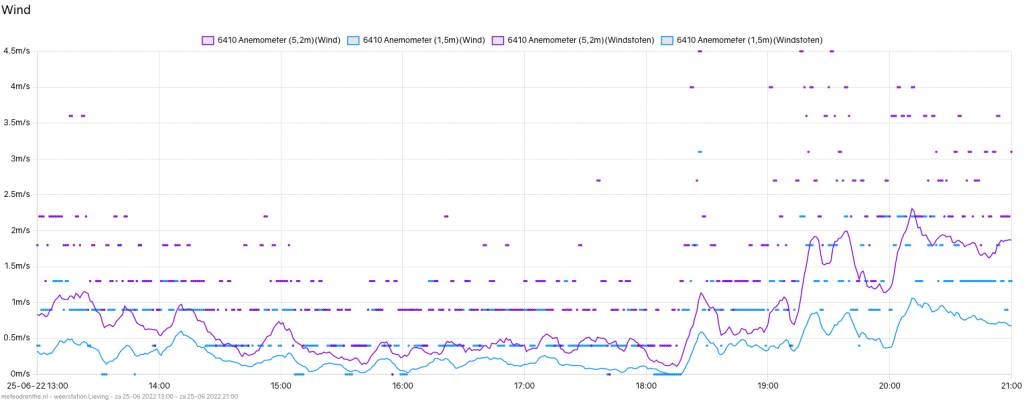
Here is the same graph with winds speed readings projected onto it.
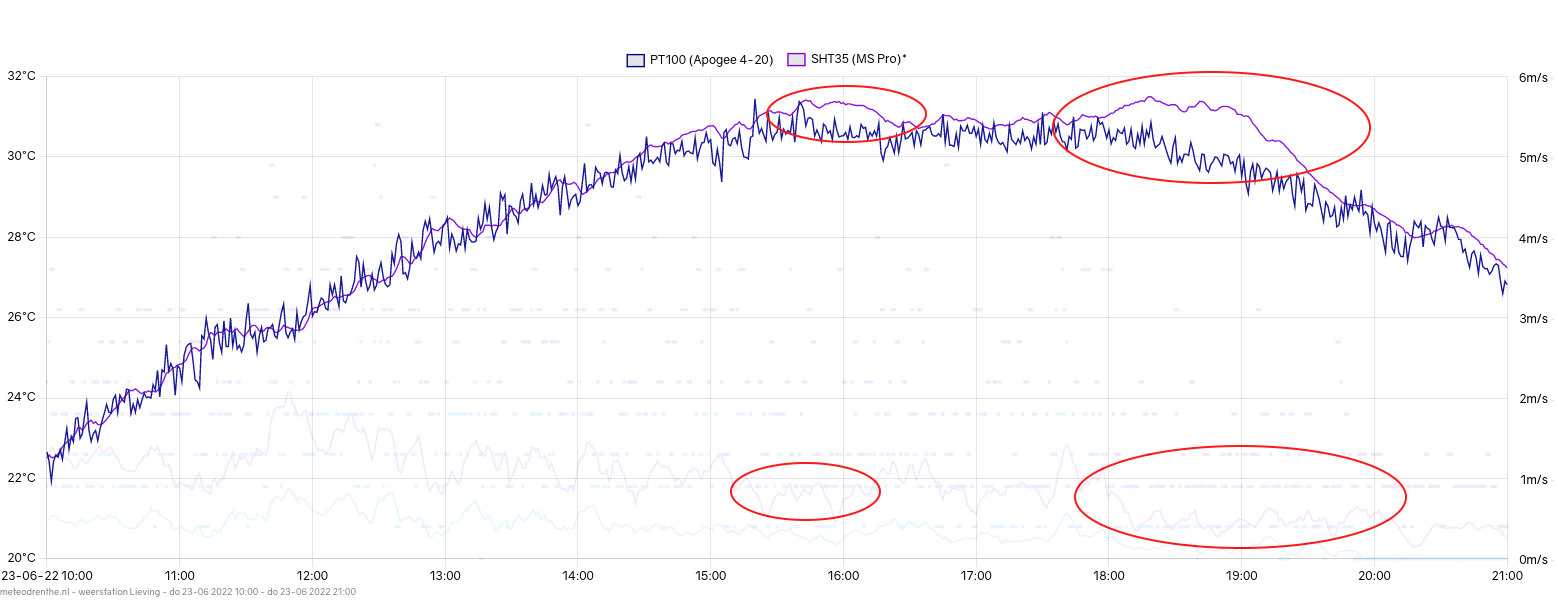
The graph contains data from 2 anemometers. One at 5,20 m and one at sensor level, roughly 1,80 m. I take the first one as reference. If we look at the wind speed graph, we notice that since noon, the average wind speed is slowly dropping. Around 14:30 it hits 1 m/s. At that point, the Barani and Apogee graphs slowly start to drift apart. After 15:15 the wind speed drops a bit further still, under 1 m/s. Shortly after, we see the first significant deviation in the two graphs. Wind speed picks up slightly after 16:00 again, a little bit above 1 m/s. Interestingly, we don’t see the same effect after 17:00 when wind speeds drop off again just a little bit.
The real effect is seen after 18:00, when wind falls of entirely to below 0,5 m/s. Then the Barani really falls behind drastically. Because it’s June, the Sun is still high in the sky at this point. Wind speeds don’t recover after this time. It’s mostly because the evening is progressing and solar radiation is dropping further that eventually the sensor inside the Barani starts to cool down too. In part this is due to the fact that the sun drops behind some trees and the weather station is shielded from direct solar radiation by then as well. This is visible in the radiation graph.
The passive radiation shields suddenly heating up after roughly 18:00 can be seen more often. Here is a similar effect on June 17th.
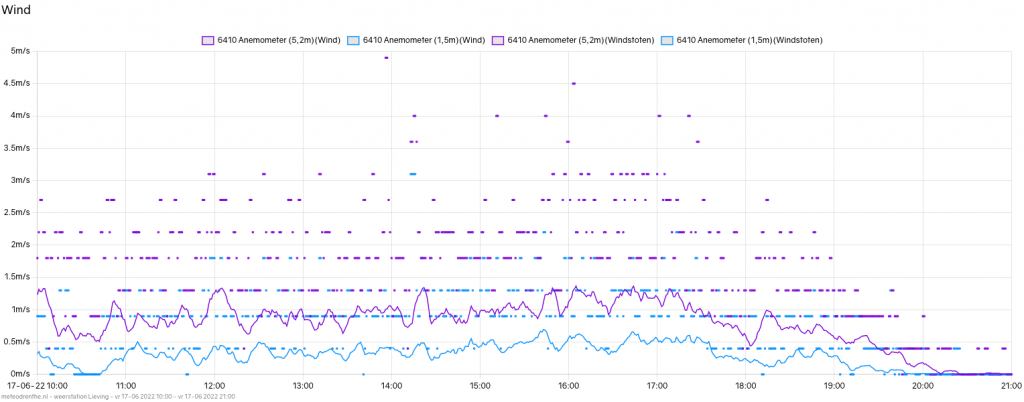
Overall winds were no higher than 1 m/s on average during the entire day, so the Barani struggled a bit all the time. After roughly 18:15 we see a decline until after 20:00 wind is non existent.
Here is a recent example where the opposite happens, with winds increasing significantly after 18:00 with the Barani recovering due to it.
All this is not unexpected at all. At some point, passive radiation shields just suffer from solar radiation errors. It is important to note that graphs like these of relatively rare. Situations where the passive Barani shield suffers for a longer period are limited to a handful of days in a single year. At least here in the Netherlands.
So while I have been mentioning the Barani having a hard time keeping up sometimes, let me put that in perspective by sharing my other sensors on June the 23rd.
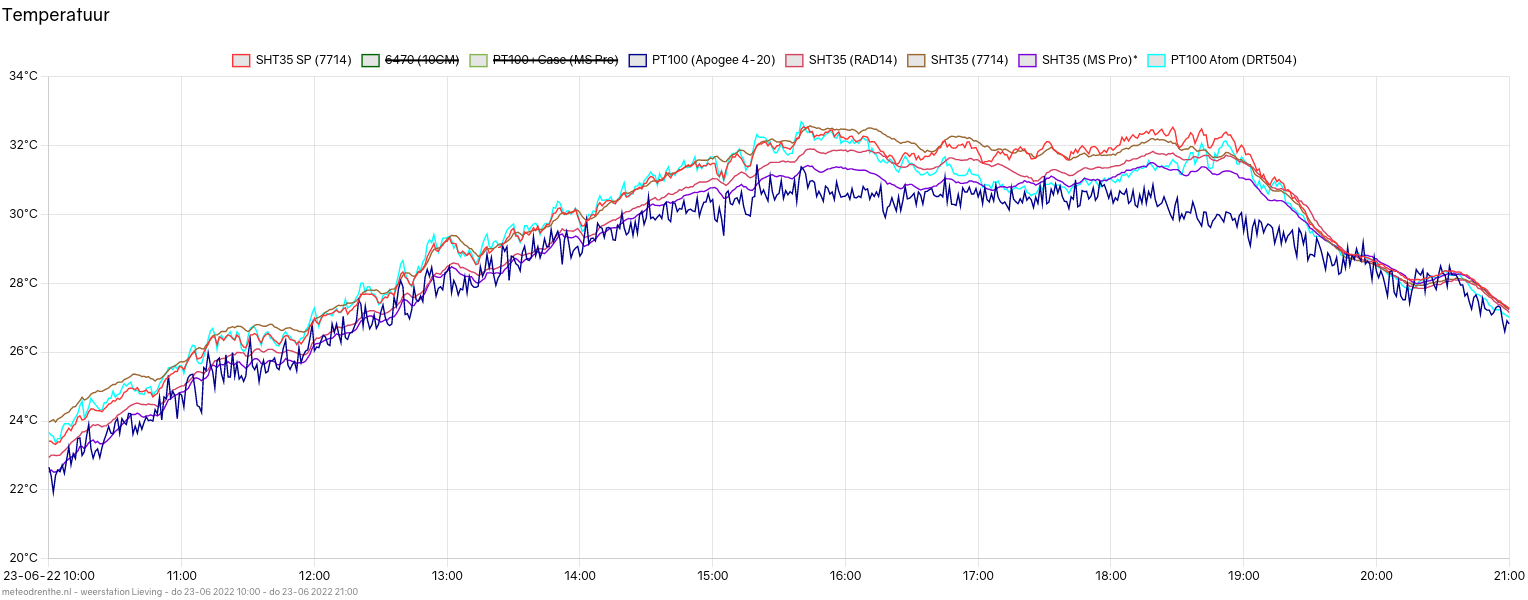
It is apparent that all of these radiation shields – though not all were necessarily optimized for performance in terms of setup – are having an even harder time. Even at higher wind speeds they often show overheating.
Even after running the Apogee for nearly a year now, my primary sensor is still the Barani + SHT35. This is in part because I have not yet settled on what I think of the erratic readings produced by a very responsive PT100 inside an actively ventilated shield. As can be seen in the first temperature graph I shared in this post, on days with sufficient natural ventilation, temporary spikes in PT100 readings will often result in a daily maximums a few tenths higher than the SHT35. Daily maximum temperature from the SHT35 is usually very much in line with official KNMI readings. KNMI graphs are usually also a lot smoother, even though it also uses platinum resistance thermometers (PT500 I believe). Until I figure out what is going on here, I will stick with my passive setup. More on this in a future post.