
In February I wrote a post about the responsiveness of the temperature sensors I am using. One caveat I noted then, was that I was comparing SHT35 sensors with PT100 sensors while the latter were actively ventilated and the first were not.
In the mean time I made a few changes to my setup. Most importantly, I moved a PT100 to a Barani MeteoShield Pro, in order to more properly compare it with an SHT35 inside a second Barani shield.
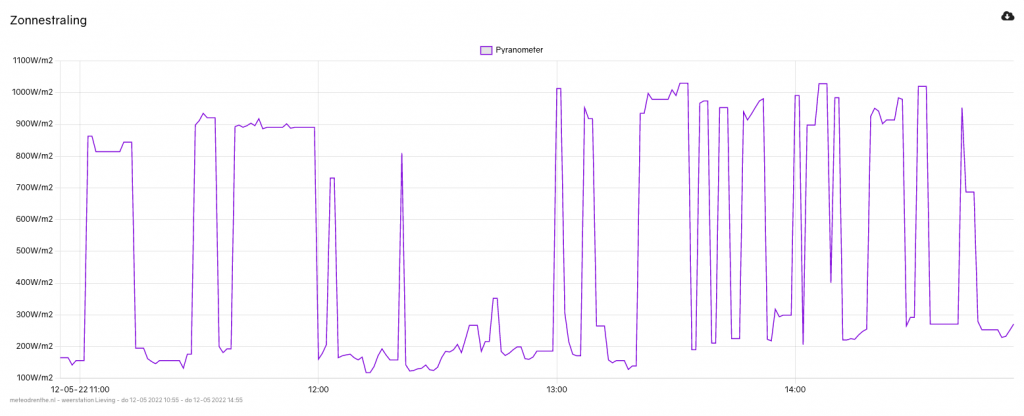
By now it’s also well into May, and solar radiation is much higher than in February. Last Thursday was partly cloudy day, with periods of high and lower solar radiation. This is the pyranometer graph:
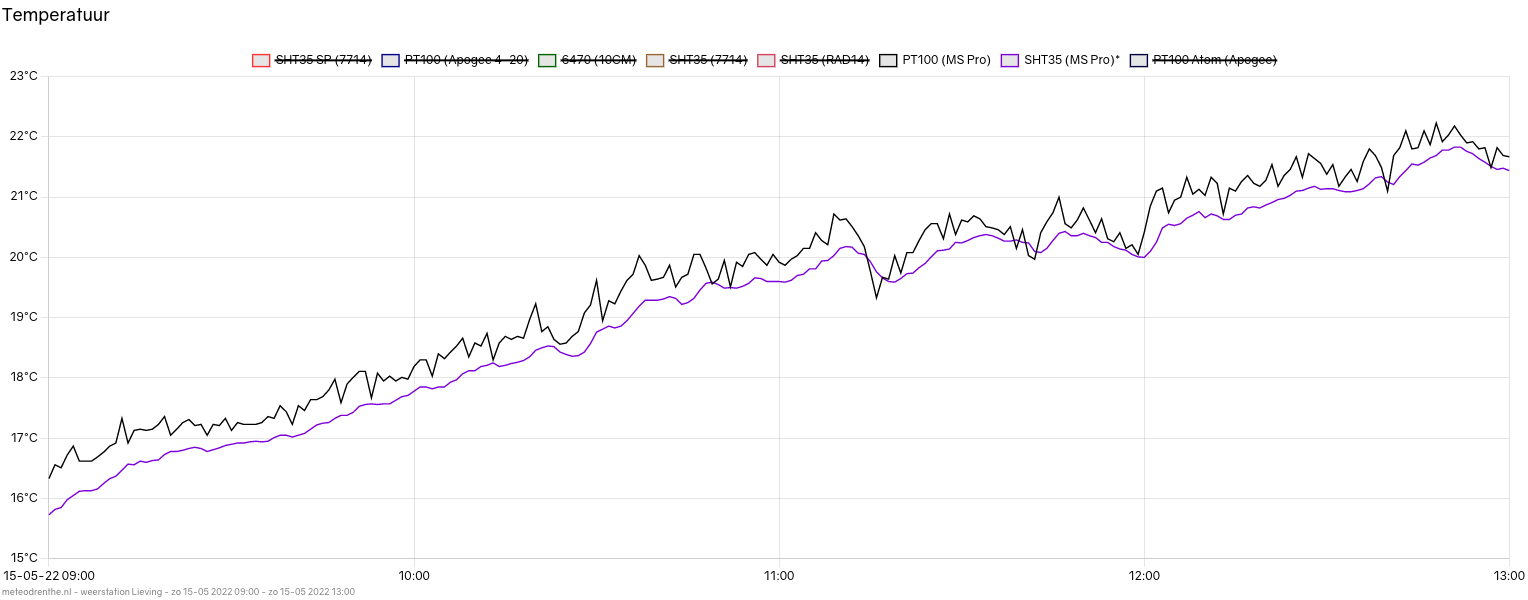
Below is the temperature graph for the same time frame. I’ve included the SHT35 and PT100 sensors in the Barani shields, as well as the PT100 in the actively ventilated Apogee TS-100.

With winds just averaging under 1 m/s at sensor level, the passively ventilated PT100 is responding mostly just as quickly as the actively ventilated one. In effect that means that, at fairly low wind speeds, the Barani shield is performing just as well as the Apogee shield.
What about the difference between the SHT35 and the PT100? Since there isn’t much difference compared to my previous observations in February, the conclusions are the same. It is clear that whenever temperatures rise, all sensors do, but the SHT35 is always lagging behind. Temperature rises and drops are more pronounced in the PT100 graphs. They show clear spikes.
This makes sense. Whenever the ambient temperature rises to a certain level, it will start dropping again at some point. For sensors with more lag, ambient temperature will have often dropped well below that maximum by the time the sensor might have caught up. E.g. if the ambient temperature settles at 20 degrees at 12:00, it might take the sensor until 12:05 to reflect that. However, if the temperature drops to 19.5 degrees between 12:00 and 12:05, the maximum the sensor would read would be somewhere between 19.5 and 20.
In relation to this, what does puzzle me a bit, is that the maximum values being read by the PT100 seems to be a bit on the high side. The daily extremes for the SHT35 mostly lines up pretty well with the nearest official KNMI station. Temperature spikes registered by every PT100 during day time are usually several tenths higher. If I were to take a PT100 as my primary sensor, my weather station would show daily maximums consistently higher than KNMI readings.
Either the PT100 sensor I use is flawed in that it might suffer from radiation induced spikes in ways the SHT35 is not. Or maybe the PT100 does reflect ambient temperature and my station is simply located in an environment where temperatures rise a bit more than at the KNMI station location. My station is located in a pretty decent spot, but it’s nowhere near as exposed as at the air field being used by the KNMI at Hoogeveen. Another option is that temperature actually do spike in a similar manner at the KNMI station but their methods level out the spikes in some way, perhaps by using rolling averages. I simply don’t know this. It’s something I’d like to find out at some point.
What about performance?
So this was mostly about the responsiveness of the sensors. Let me share another pair of graphs focusing on performance when it comes to mitigating radiation errors. This morning had clear skies, higher solar radiation and lower wind speeds of 0.5 m/s at sensor level.

This graph shows two actively ventilated PT100 sensors versus the SHT35 in the Barani shield. The jumping up and down of the PT100’s is present again. But the SHT35 graph is sitting pretty much right where you’d expect a rolling average of the PT100’s to be. Pretty neat! Even at low wind speeds and high solar radiation, the Barani + SHT35 is a very nice combo.
How about the Barani + PT100 combination? Let me compare it directly with just the SHT35.
While in my first temperature graph the passive PT100 graph was similar to the actively ventilated ones, it is clear that this is no longer the case under these circumstances with lower winds. Not only does the Barani + PT100 appear less responsive than the sensors inside the actively ventilated shield now, it’s also reading about 0,3 degrees higher consistently. This wasn’t the case before. In the first graph all PT100 sensors were reporting the same. We can’t simply attribute this to the Barani underperforming due to lack of ventilation, since the SHT35 is also housed inside the same shield. Perhaps somehow the PT100 suffers from lack of ventilation sooner. During the coming Summer I will be monitoring the behavior of the sensors and share more data when I have it.