
In this post, I explained how I used an Adafruit MAX31865 clone in order to read a PT100 temperature sensor. Since then, I’ve tested an original Adafruit version as well. Accuracy from this board is a lot better. While I had to add a calibration offset of somewhere between 0.8 and 1.5 degrees to configurations using the former, the original Adafruit board only needed calibrations of about 0.1 degrees, up to 0.2 at the worst.
Still, I remained uncertain about apparent instability in the sensor readings. These could be partially explained by the fact that the PT100 sensor is a lot more sensitive to changes than the SHT35. This can be verified in a controlled environment. Any changes in temperature would be more pronounced with the PT100. Nevertheless, noise or other culprits might be interfering with the reading, and I wanted to try an alternative to see if readings could be stabilized a bit more.
4 – 20 mA transmitter
I ended up trying this specific transmitter. It is designed to output a 4 – 20 mA current loop signal. At the low end of the temperature scale, the transmitter outputs 4 mA, while 20 mA represents the maximum temperature value. These transmitters are designed for an industrial setting where they can be mounted on the head of a sensor device. However, there is no reason why I can’t use them for my weather station and wire it up with a Wemos D1 Mini.
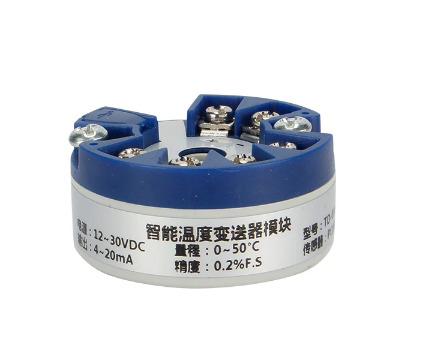
At the top of the transmitter there are 4 screws to connect between 2 and 4 wires from a PT100. Two other connectors are for the power supply. The power supply loop will also carry the 4 – 20 mA to be read.
The transmitters are sold with a preconfigured temperature range, but a custom USB cable and configuration software allows for adjustment of this range. I ordered a transmitter with a -50 to 100 degrees Celsius range. Per default, 4 mA will then represent -50 and 20 mA 100 degrees. Adjusting this to better represent temperature values that might actually be measured in an outdoor environment – let’s say -30 to 45 degrees Celsius – is preferable. I will get into the configuration at the end of this blog.
How to measure 4 – 20 mA
Current can’t actually be measured by microcontrollers like the Wemos D1 Mini. They can, however, measure voltage. Ohm’s law allows for the conversion of current to voltage. It dictates V = I * R. Voltage (V) equals current (I) multiplied by resistance (R). The analog input of the Wemos (which can read voltage) can handle up to 3.3V input. Since the maximum current would be 20 mA, we have both voltage and current, which allows for the calculation of the required resistance to convert the 0.02 amps (20 mA) to 3.3 volts. The formula for this is R = V / I. Thus, 3.3 volts / 0.02 amps = 165. In order to convert 20 mA to 3.3 volts, we need a 165 ohm resistor. At the low end, 4 mA results in (V = 0.004 amps * 165 ohm) 0.66 volts. A 165 ohm resistor will convert a 4 – 20 mA signal into 0.66 – 3.3 volts.
Note that many tutorials explain reading 4 – 20 mA using a 250 ohm resistor. This applies to other microcontrollers like the Arduino, which handles 5 volts. (5 volts / 0.02 amps = 250 ohm).
The resistor
So, the first crucial component is a resistor. A 165 ohm resistor is not particularly common, I have found. An alternative could be something like a 150 ohm resistor, which would yield a maximum of 3 volts. More important is the precision of the resistor. Common cheap resistors often have a precision of 5%. That would mean a 165 ohm resistor could be anywhere between 156.75 and 173.25 ohm. Taking a simple example, a 10 mA output could end up being anything between 1.56 and 1.73 volts. In my eventual configuration, that would mean an uncertainty of almost 5 degrees Celsius!
Affordable resistors are available with a 0.1% precision. Resulting uncertainty potentially caused by the resistor is then reduced to less than 1-tenth of a degree.
The ADC
Conversion of the voltage to a digital signal that can be processed, is done using an ADC or analog to digital converter. The Wemos board has one with the AO analog pin. However, this converter only has a 10-bit resolution, which results in a maximum of 1024 output values. Having only 1024 steps means that on a scale of -30 to 45 degrees, every step represents 0.073 degrees. That resolution is way too low for my liking. On top of that, the accuracy of the converter is said to be poor. It’s sufficient if you want to gauge the charge of a battery, but not for relatively high-precision temperature measurements.
The best alternative is bringing in an external ADC with the ADS1115. This is a 16-bit converter which is more than up to the task. Using differential input it is able to read the signals of 2 sensors, with 2 pairs of wires connected to the A0 to A3 pins. The connection with the Wemos is done via I2C, a familiar and simple connection method I have been using for other temperature sensors as well.
A partial wiring diagram can be seen below. The 12V supply is connected to the input/output of the transmitter. On the negative side, a 165 ohm resistor is added. A0 is connected to a point before the resistor, A1 to a point after the resistor.
When you use a multimeter to measure the voltage, A0 and A1 are the points of measurement as well. The image below shows the alligator clips of the multimeter connected to both sides of the resistor.
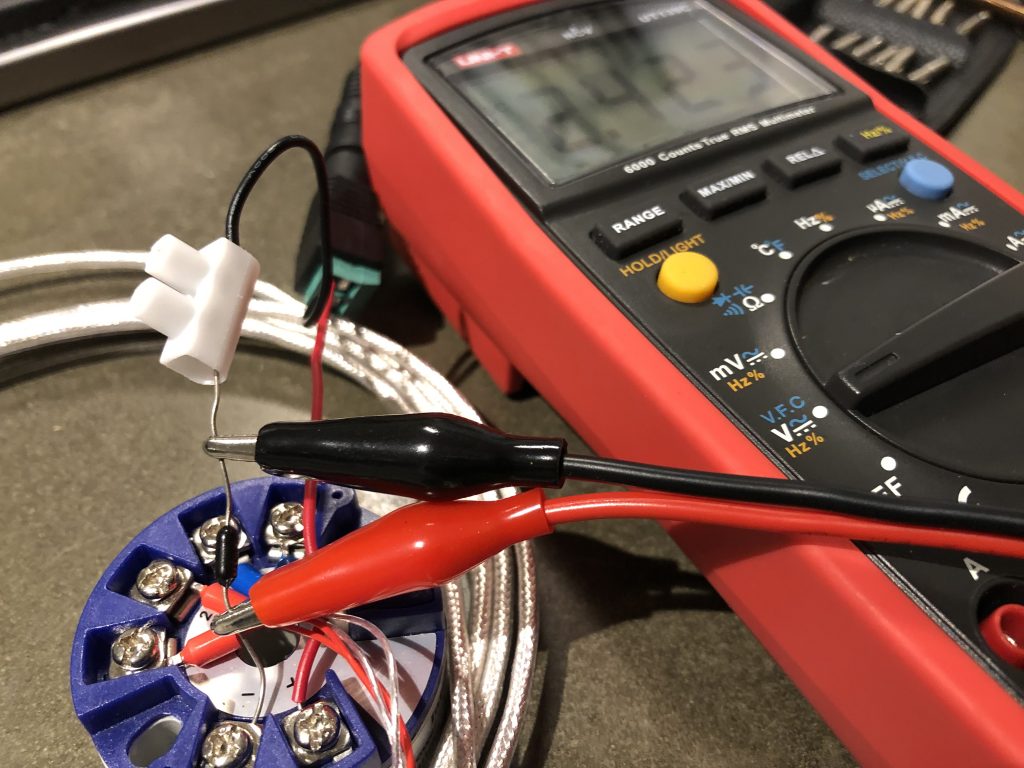
The voltage measured this way is 2.423. How to calculate the temperature? The range is 0.66 V (4 mA) to 3.3 V (20 mA). That means there are (3.3 – 0.66) 2.64 volts to represent a range of 75 degrees (-30 to 45). That is 0.0352 volts per degree. So, we take the 2.423 volts, subtract the 0.66 degrees to get the value relative to zero (4 mA = 0.66 V). 2.423 – 0.66 = 1.763. That value divided by 0.0352 results in 50.08. Since that is the amount of degrees starting from -30, we subtract 30, to end up with a value of 20.08 degrees Celsius. Perhaps there are alternative ways to reach the same result, but this works just fine for me.
Reading the ADS1115
How to make the Wemos microcontroller process the same voltage measurement and calculate the temperature value? For this, as mentioned, we link it to the ADS1115. The connection is straight forward. VDD, GND, SCL and SDA represent the familiar pins for an I2C interface. These are (typically) connected to 3V3, GND, D1 and D2 on the Wemos board. In my case, A0 and A1 represent the two measuring points just referred to.
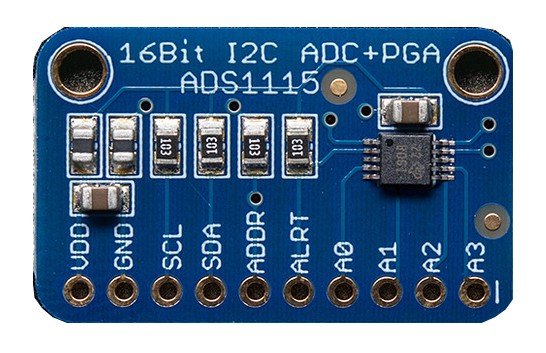
Before continuing, let me share a warning. As with many Adafruit products, there are various clones available on the market. This is true for the ADS1115 as well. In my initial attempts to make this setup work, I used one of those cheaper versions. Though the accuracy seemed to be OK, the resolution was lower than expected. As it turns out, behavior of the board was in line with the ADS1015. This board looks similar, but only has a 12-bit resolution in stead of 16 bits. This makes a huge difference. Only when ordering an original (more expensive) Adafruit version did I get proper resolution. As is evident from various forum topics across multiple websites, other users have had this issue. Apparently, someone went through the effort of making an ADS1015 look like an ADS1115! Not all clones are 12-bit fakes though, so just make sure to double check when buying one.
The sketch
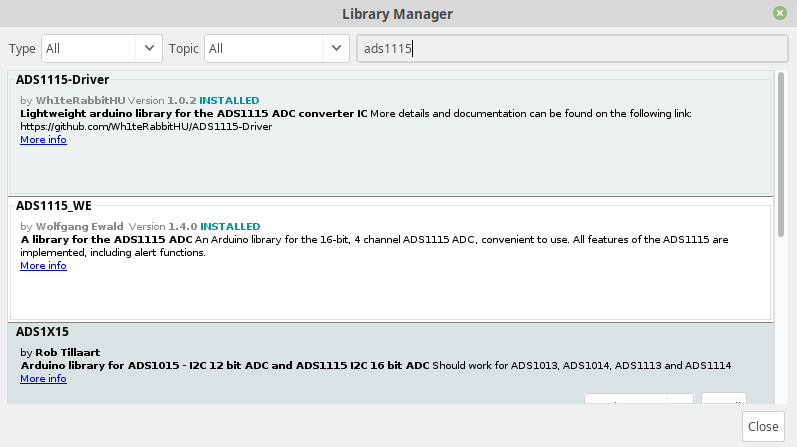
Let’s move on with the required code. Once again I use the Arduino IDE to write a simple sketch to achieve this. Several libraries are available that allow simple communication with the ADS1115 board. I tried several, and they all seem to their (simple) task just fine. Below, I use an available example sketch in the ADS1X15 library to print the temperature value from the PT100 sensor.
The example sketch is called ‘differential’. It is ready made to read a value from the A0 and A1 pins in differential mode. As is, the sketch will print the measured millivolts to the serial monitor. Considering the voltage on the analog input will never exceed 3.3 volts, there is the option to increase the gain value to 1x gain, which increases resolution of each step from 0.1875 mV to 0.125 mV.
Let me pause there for a bit to look at what that means. The ADC outputs an integer value which represents a certain number of volts depending on the gain setting. The default gain setting is intended for -6.144 to 6.144 volts. At 0.1875 mV per step, that is (6144 / 0.1875) 32768 x 2 = 65536 steps, which is the equivalent of 16 bits (2^16 = 65536). So a value inside the voltage range will be represented by a number between 0 and 65536.
In my setup, I can only use a part of the voltage range. As calculated above, 2.64 volts (0.66 to 3.3). If we divide that by 0.1875, we get 14080 steps we can actually use. Specifically the values 36288 to 50368. Since the ADC will never be exposed to anything lower than 0.66 volts or higher than 3.3 volts, it should never output anything lower or higher than those numbers. Based on the transmitter configuration, those steps get spread out over 75 degrees (-30 to 45). In other words, each step represents (75 / 14080) roughly 0.005 degrees. That is our theoretical resolution as far as the ADC is concerned. In my book, anything more precise than a 0.01 degree resolution is unnecessary and quite possibly far beyond pointless depending on the quality of the sensor and other factors. There is no need to increase the gain. If I did want to do so, the only gain setting available would be 1x gain, since the next gain level (2x) allows for a maximum input voltage of 2.048 volts, which is too low.
Back to the sketch. The example sketch already tells us how to get millivolts. We multiply the numeric result by 0.1875. In the following function, we take that result to calculate temperature.
float calculateTemperature(float mV) {

  float ampsMin = 4; // 4 mA
  float ampsMax = 20; // 20 mA

  float minTemp = -30; // 4mA or 0.66 V
  float maxTemp = 45; // 20mA or 3.3 V

  int16_t resistor = 165;

  //  V = A x 165;
  float mVMin = ampsMin * resistor;
  float mVMax = ampsMax * resistor;

  float mVPerDegree = (mVMax - mVMin) / (abs(minTemp) + maxTemp); // 35.2 mV

  float celsius = ((mV - 660) / mVPerDegree) - abs(minTemp); // 660 mV is zero, zo subtract 660, divide by 35.2 to get degrees on 0 - 75 scale (-30 to 45), substract 30 because range starts at -30

  return celsius;
}
I’ve made all values explicit. A final sketch will likely be more compact. The important part is the final calculation. There, 660 millivolts (0.66 volts) are subtracted from the measured value. That result is divided by the amount of millivolts per degree (35.2) which results in a temperature value which starts from -30. Subtracting 30 yields the correct value.
Here is a series of serial monitor outputs containing the original value from the ADC, the converted value in millivolts and the calculated temperature:
21:38:19.043 -> Differential: 12537 (2350.69mV) 18.03C
21:38:20.040 -> Differential: 12536 (2350.50mV) 18.03C
21:38:21.039 -> Differential: 12538 (2350.88mV) 18.04C
21:38:22.070 -> Differential: 12539 (2351.06mV) 18.04C
21:38:23.067 -> Differential: 12540 (2351.25mV) 18.05C
21:38:24.065 -> Differential: 12538 (2350.88mV) 18.04C
21:38:25.097 -> Differential: 12538 (2350.88mV) 18.04C
21:38:26.097 -> Differential: 12538 (2350.88mV) 18.04C
21:38:27.095 -> Differential: 12542 (2351.63mV) 18.06C
21:38:28.127 -> Differential: 12536 (2350.50mV) 18.03C
21:38:29.126 -> Differential: 12536 (2350.50mV) 18.03C
21:38:30.120 -> Differential: 12539 (2351.06mV) 18.04C
21:38:31.150 -> Differential: 12543 (2351.81mV) 18.06C
21:38:32.148 -> Differential: 12535 (2350.31mV) 18.02C
21:38:33.179 -> Differential: 12537 (2350.69mV) 18.03C
21:38:34.177 -> Differential: 12539 (2351.06mV) 18.04C
21:38:35.176 -> Differential: 12541 (2351.44mV) 18.05C
21:38:36.207 -> Differential: 12536 (2350.50mV) 18.03C
21:38:37.206 -> Differential: 12537 (2350.69mV) 18.03C
21:38:38.205 -> Differential: 12539 (2351.06mV) 18.04C
21:38:39.235 -> Differential: 12538 (2350.88mV) 18.04C
21:38:40.230 -> Differential: 12535 (2350.31mV) 18.02C
21:38:41.225 -> Differential: 12537 (2350.69mV) 18.03C
21:38:42.253 -> Differential: 12539 (2351.06mV) 18.04C
21:38:43.249 -> Differential: 12538 (2350.88mV) 18.04C
21:38:44.277 -> Differential: 12534 (2350.13mV) 18.01C
21:38:45.272 -> Differential: 12539 (2351.06mV) 18.04C
21:38:46.301 -> Differential: 12538 (2350.88mV) 18.04C
21:38:47.296 -> Differential: 12538 (2350.88mV) 18.04C
21:38:48.292 -> Differential: 12535 (2350.31mV) 18.02C
21:38:49.320 -> Differential: 12537 (2350.69mV) 18.03C
21:38:50.315 -> Differential: 12538 (2350.88mV) 18.04C
21:38:51.345 -> Differential: 12538 (2350.88mV) 18.04C
21:38:52.340 -> Differential: 12539 (2351.06mV) 18.04C
21:38:53.337 -> Differential: 12536 (2350.50mV) 18.03C
21:38:54.367 -> Differential: 12539 (2351.06mV) 18.04C
21:38:55.362 -> Differential: 12539 (2351.06mV) 18.04C
21:38:56.395 -> Differential: 12537 (2350.69mV) 18.03C
21:38:57.392 -> Differential: 12536 (2350.50mV) 18.03C
21:38:58.389 -> Differential: 12538 (2350.88mV) 18.04C
21:38:59.420 -> Differential: 12540 (2351.25mV) 18.05C
As can be seen, during this 40 second period, values range from 18.01 to 18.06 degrees, but most readings are either 18.03 or 18.04. I am guessing some noise is involved, but nothing too extreme yet. I will have to see how that develops when I mount everything into its final location, with multiple signals and power lines that could cause disturbances. For now, I am pleased with this result. Taking multiple readings and averaging them might be indicated to filter out the ‘extremes’.
Configuring the transmitter
The PT100 transmitter I use has a specific USB cable and configuration software. My impression is that each manufacturer of this type of transmitter has something similar. Besides configuring the transmitter, the software also allows for displaying the measured temperature.
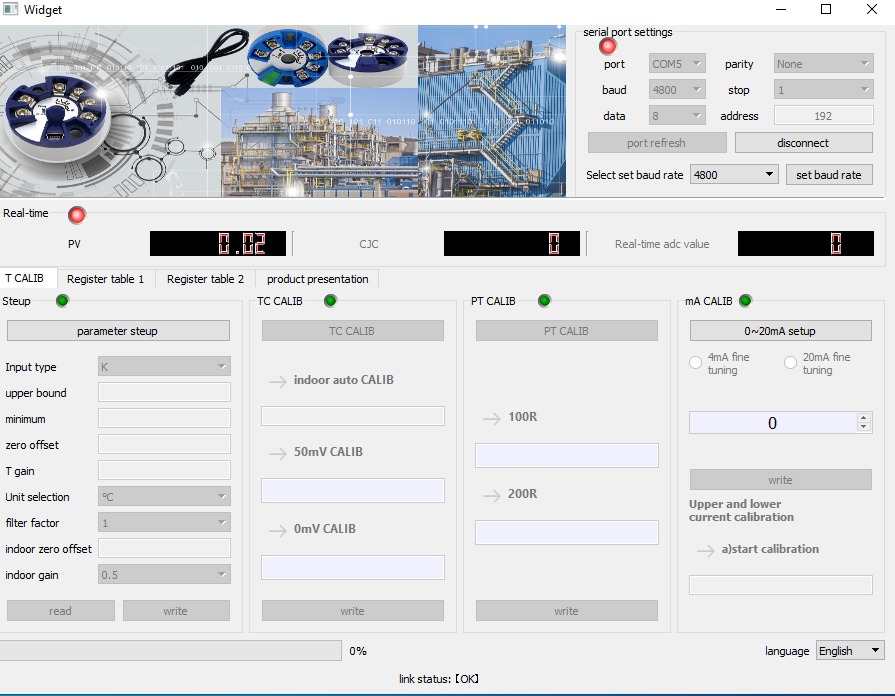

This example shows a value of 0.02 degrees Celsius. As you might have guessed, this was is the result displayed during my attempt to calibrate the sensor. I was happy to see this ice calibration resulted in a value very close to freezing temperature. This is an improvement over earlier efforts with the MAX31865, which never got me closer to zero than 0.1 degrees. That said, this value of 0.02 is the internal output of the transmitter. It is a digital output from the device itself. It may very well be that the 4-20 mA signal it produces is less accurate. An extra uncertainty is introduced with the ADC and the 165 ohm resistor. Both elements, depending on how precise they are, can hurt the overall accuracy of the setup.
As for the configuration of the transmitter, the website of the manufacturer (which lacks an SSL certificate at the moment I am writing this, that always looks bad) offers ‘Transmitter config software’ that allows for changing some key parameters. I have only used it to adjust the ‘upper bound’ and the ‘minimum’ values from the defaults of 100 and -50 to a more realistic 45 and -30. The reasoning here is simple. With a range spanning only 75 degrees in stead of 150, resolution is increased. Considering the earlier mentioned 0.005 degrees resolution, tweaking the configuration may not be terribly important, A transmitter with the default range will suffice. It also saves you from paying for an extra USB cable made specifically for the transmitter.
Another pitfall and the final setup
I had planned to write about a different final setup here. Usually, I design and order a custom PCB at JLCPCB. As has happened to me before in the past, I made a mistake designing it. When this happens, sometimes its a small design flaw that can be fixed. This time I ended up destroying and ADS1115 and a TP4056 in the process. No point in dwelling too long on that, but the design of the board was such that it was difficult to avoid overvoltage on some parts.
Another mistake was not realizing that the analog inputs on the ADC should not have voltage applied to them when the board is not powered. The datasheet says the inputs can handle VDD +0.3. This is 3.6V under working conditions, but not without the microcontroller plugged in to supply voltage to the ADC.
In future board designs that use components that are not solely powered through the microcontroller, I will definitely look into adding switches or relays so I can easily switch off specific voltage sources.
As for my setup now, I have used a different custom PCB designed for a different purposes which could, with some additional wiring, be used for this case. This is the top view of the box containing the components.
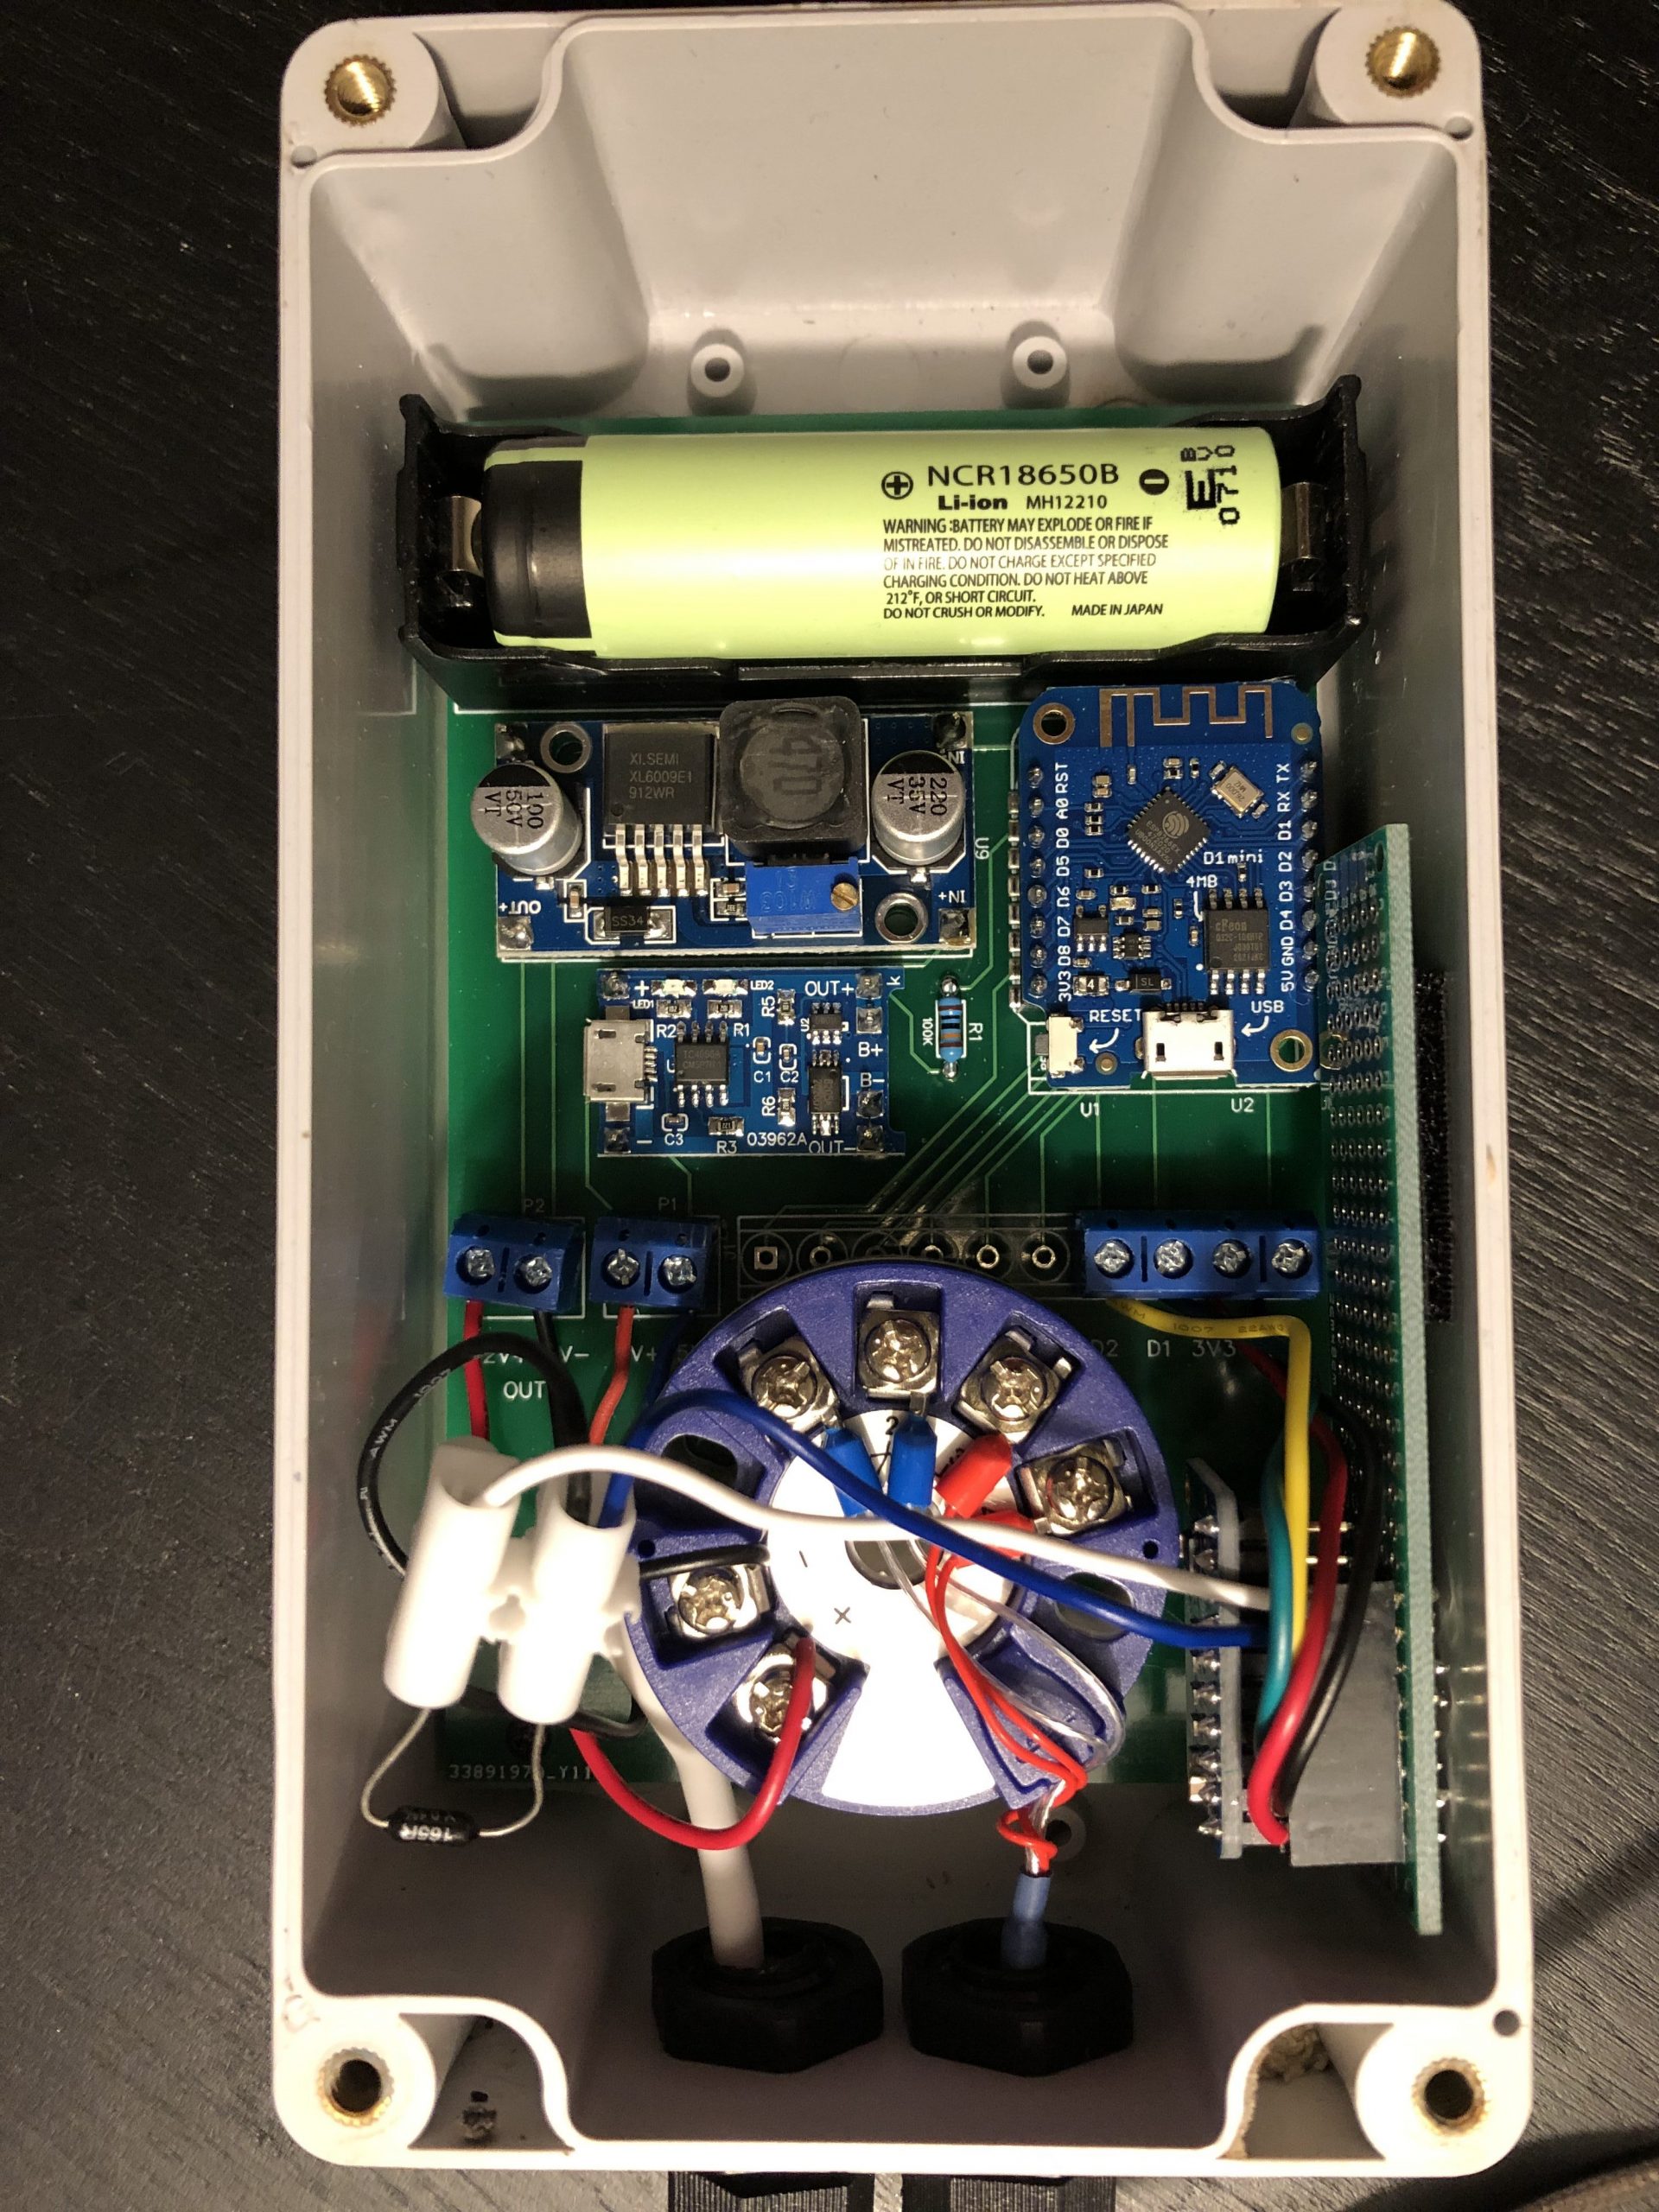
It has the following components:
- Wemos D1 Mini
- TP4056 battery management board
- 18650 battery holder
- XL6009 step up boost converter
- ADS1115
- PT100 transmitter
- 165 ohm resistor
- Screw terminal for 5V input
- Screw terminal for 12V output
Let me mention what the relevant parts do. The Wemos D1 Mini is the microcontroller running the sketch/code. The TP4056 receives 5V input, charges the battery and also supplies power to the microcontroller. I use an XL6009 to convert 5V to the 12V required for the PT100 transmitter. I could have opted for an external 12V supply, which I also have available. But that supply does not have battery backup yet. The ADS1115, PT100 transmitter and resistor have been discussed. The 5V supply speaks for itself. The 12V output is available through screw terminals. Two wires can carry the charge to the transmitter.
Since the board has no spot for the ADS1115, I’ve soldered it onto a prototyping board and stuck it to the side of inside of the box. The blue and white wires are the analog inputs, while red, black, yellow and green connect to the Wemos microcontroller via the row of 4 screw terminals.
As always, the sketch running on the Wemos processes the input, connects to WiFi and forwards the data to the Meteodrenthe server.
The coming weeks, I will be taking the time to compare the readings with those of the identical PT100 sensor processed using the MAX31865. Those findings will be shared in another post.