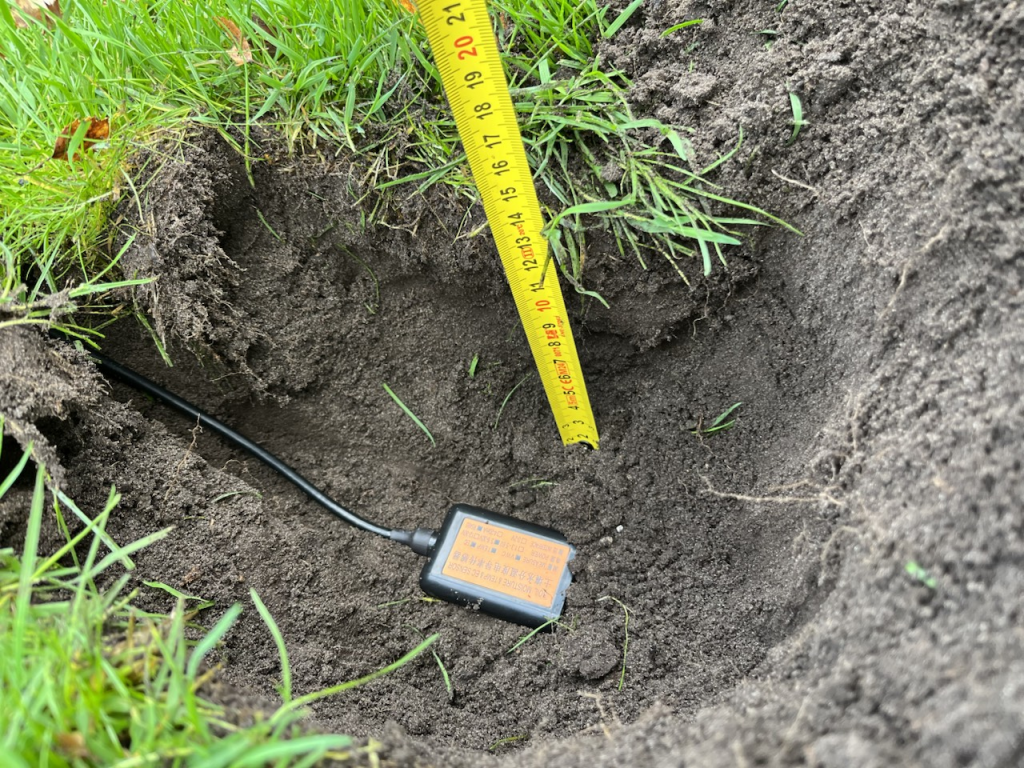
My project for the Fall of 2025 was the MTEC-02A soil moisture sensor from Seeed Studios. The sensor is made to be inserted or buried in the soil and returns 3 metrics: temperature, volumetric water content (VWC) and electrical conductivity (EC). A great way to track periods of drought in the Summer that occur more frequently in past years.
The device requires a 3.6 ~ 30V power supply. Since I have 12V available this will be no issue. It communicates using the Modbus protocol over RS-485. This is new territory for my weather station setup. I have always avoided this unknown and opted for analog alternatives like 4-20mA current loops or voltage signals when not using easy-to-use breakout boards like the MAX31865 and sensors like the SHT3x. The latter has so many public libraries that integrate easily that I never even have to consider how it actually communicates.
Before getting into making the Wemos D1 Mini talk with the sensor, I want to hook it up to my computer and fire some simple commands at it to see what happens. Since a computer doesn’t understand RS-485 signals, I need an USB to RS-485 converter. For that purpose, I found this one on Amazon.
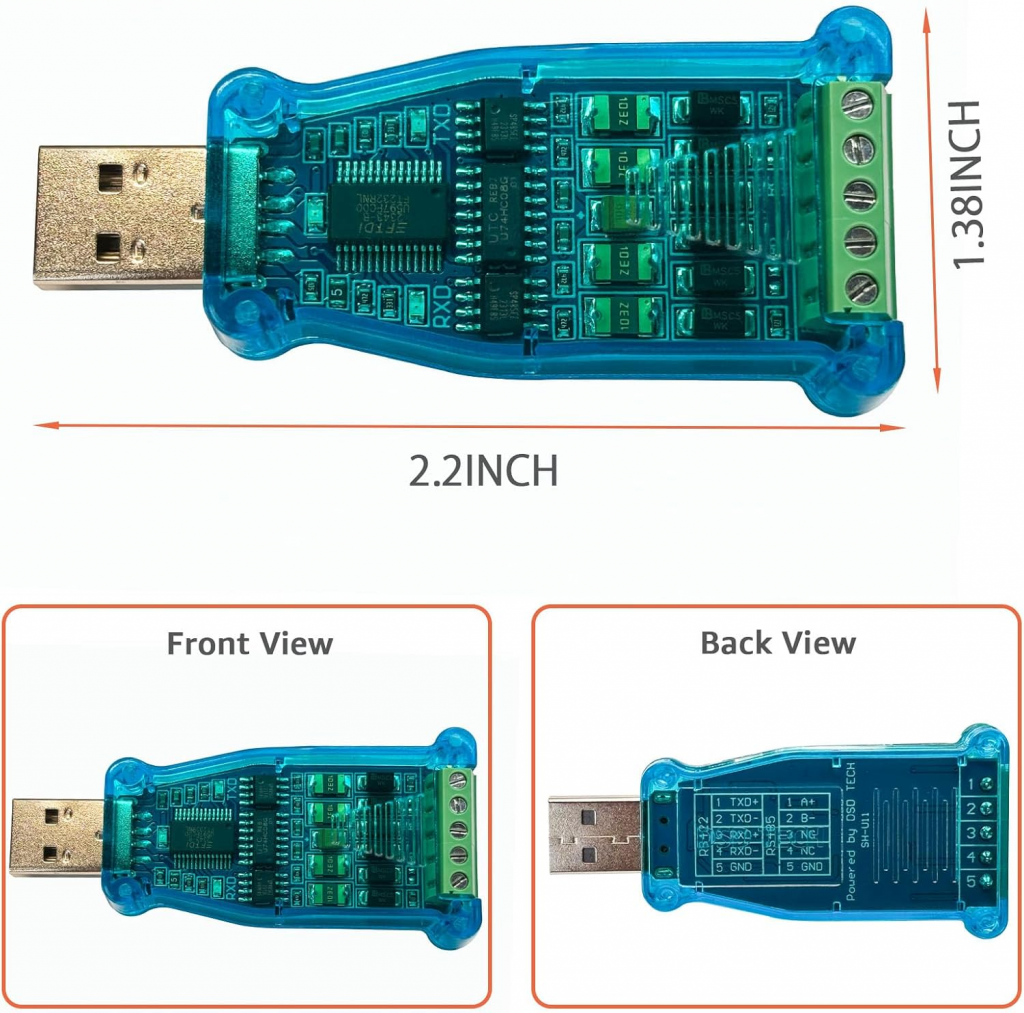
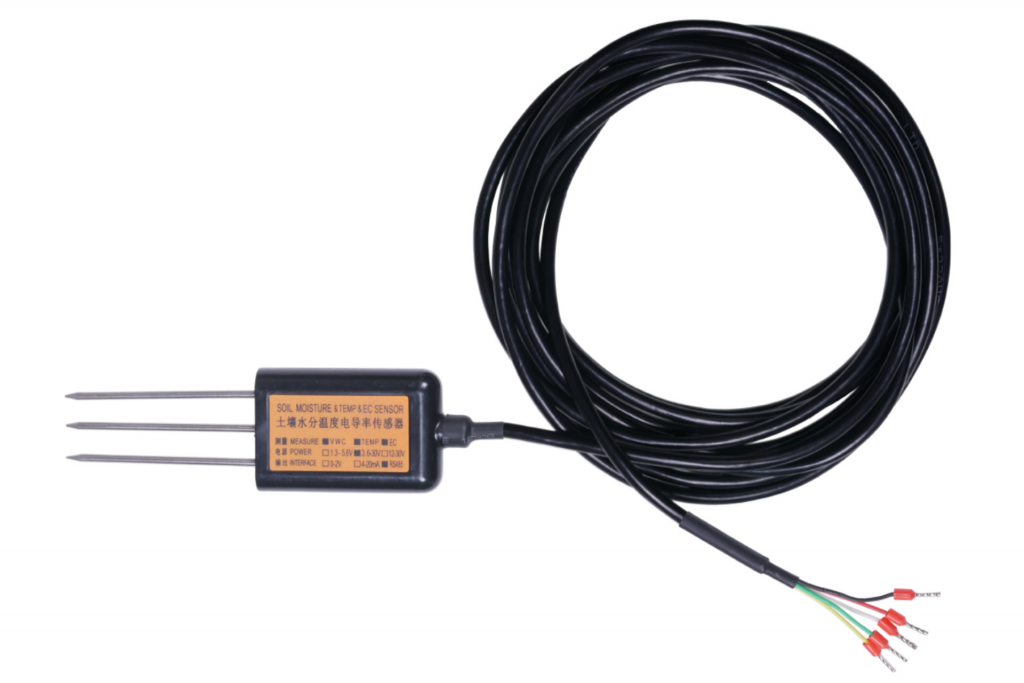
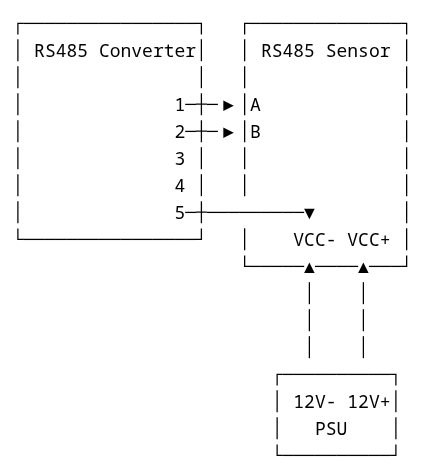
For the RS-485 interface, connectors 1, 2 and 5 correspond to A+, B- and GND. These are the only ones relevant. As per the wiring overview on page 5 of the documentation of the MTEC-02A sensor, yellow corresponds to A, white to B and black is GND.

The red (VCC+) and black (VCC-) wires are connected to a 12V power supply, and GND on the converter is linked with VCC- to create a common ground.
On my Linux machine, I use CuteCom as an easy graphical interface to send commands to and receive data from the sensor via the converter.
As the documentation explains in chapter 5, a “MODBUS message(..) contains the address of the slave, the function code (e.g. ‘read register’ or ‘write register’), the data, and a check sum (LRC or CRC).” Here is an example of a message sent to the sensor and its output.
Page 22 of the documentation lists an example of a request message that reads all 3 metrics from the sensor. I reproduce it here.

As can be seen in the screenshot above, the input was 01 04 00 00 00 03 B0 0B. Let’s unpack this.
01 (or 0x01 in hexadecimal) is the address of the slave, which is the sensor.
04 (0x04) is the function code. Page 7 of the documentation says 0x04 is the function for reading the input register, which is where the sensor measurements are stored.
Then we have 00 00 00 03 (0x0000 0x0003) which is our data. It indicates we want to read starting at register 0x0000 (which contains temperature readings) and we want to read 0x003 or 3 registers (which covers Volumetric Water Content at register 0x001 and Electrical
Conductivity at register 0x002).
B0 0B (0xB0 0x0B) is the checksum. Since in my code example below I will be using a library that automatically calculates the checksum, I will not go into the underlying algorithm. There are many checksum calculators available online. Page 21 of the documentation also lists a function that allows for the calculation of the checksum.
Ignoring the first sequence of zero’s (which is something CuteCom specific) the output looks like this: 01 04 06 07 b5 00 00 00 00 ec fe. Once again, the example on page 22 of the documentation lists a very similar response. What does it contain?
01 (0x01) we can recognize as the same slave address as out input.
04 (0x04) is the function code again.
06 (0x06) tells us the byte count of the response body. Since we are requesting 3 registers for 2 bytes each, we can a total of 6 bytes.
07 B5 (0x07B5) are the next 2 bytes. This represents the value 1973. Divide it by 100 and you get the temperature: 1973 / 100 = 19.73 °C
The next 4 bytes are all zeros. This means that both the volumetric water content and electrical conductivity read 0. The reason is simple. The sensor is still in its packaging. I can easily make those value read non-zero by placing sensor pins in my hand. The result: 01 04 06 0b 5a 12 22 00 08 9d 51. If we skip the first 3 bytes again, we start at 0b for the first register.
Register 0 0x0B5A = 2906. That means 2906 / 100 = 29.06 °C
Register 1 0x1222 = 4642. The same division yields 4642 / 100 = 46.42 % VWC
Register 2 0x0008 = 8. This means simply 8 µS/cm
Conclusion: the sensor is responding.
Connecting the MTEC-02A to a Wemos D1 Mini
Now, how do we connect the sensor with my go to Wemos D1 Mini microcontroller? Just like my laptop, the Wemos D1 Mini does not handle RS-485 signals directly. We need a converter. One that runs on 3.3V, the logic level of the D1. The SP3485 mounted on boards like the SparkFun Transceiver Breakout – RS-485 is a good option. It’s a bit expensive for what it does, though. As is usually the case, there are cheaper alternatives. AliExpress has them available for even less.

Let’s take a closer look at the pins. First the connection between the transceiver and the sensor. On the top right side the holes for the A and B pins are visible, as well as G for ground. Since this board runs on 3.3V and the sensor itself requires a higher voltage, a separate (in my case 12V) power supply is implied here too.
The pins relevant for the connection with the Wemos D1 Mini are labelled other side of the board. 3-5V and GND are for the power supply. These can be connected to 3V3 and G. RX-I and TX-0 are for receiving and transmitting data. Since the SP3485 is a half-duplex transceiver that can only communicate in one direction at a time, the RTS pin allows for switching between receiving and transmitting.
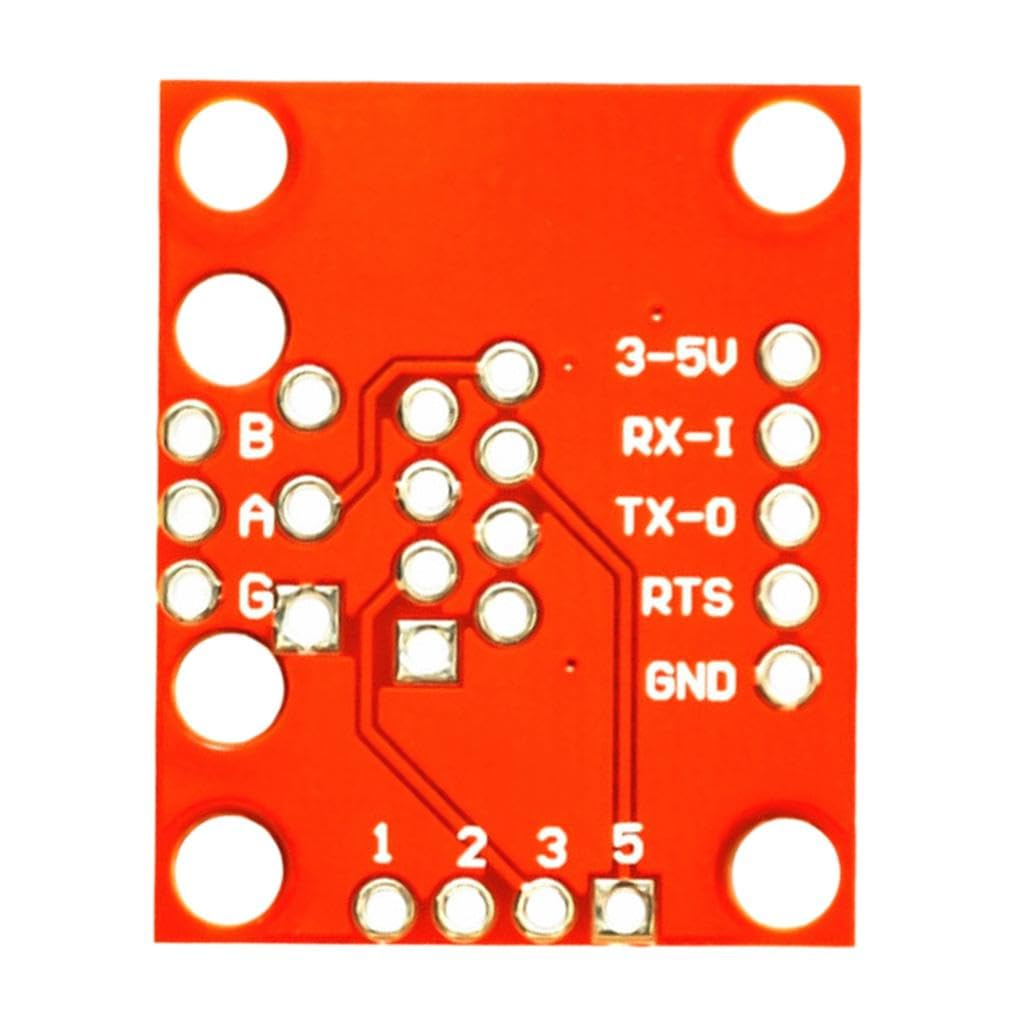
The Wemos D1 has dedicated RX and TX pins, but I’ve used the SoftwareSerial library to emulate the behavior of these pins using GPIO pins (more details on this below). In this case, I use pins D1 and D2. I connect D5 to RTS resulting in a connection schematic looking like this.
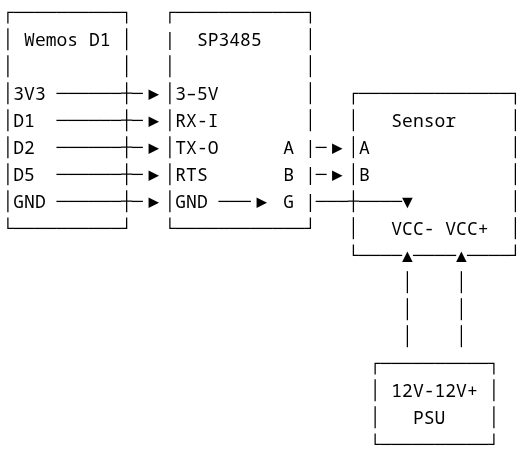
All grounds are linked. Note the connection between the Wemos D1 ground, both grounds on the SP3485 as well as the sensor ground (VCC-).
As already shared above, these are the sensor wires. The green wire SET is ignored.
Now how do write the sketch for this? Let’s start with the setup() function and its requirements.
First we start by defining some pins and creating two library objects, one for SoftwareSerial and one for ModusMaster.
#define RX_PIN D1  // GPIO5
#define TX_PIN D2  // GPIO4
#define RTS_PIN D5   // GPIO14

SoftwareSerial rs485(TX_PIN, RX_PIN);

ModbusMaster modbus;
SoftwareSerial is used to emulate the serial data stream using normal GPIO pins D1 and D2 (defined here as RX_PIN and TX_PIN). It lets the Wemos D1 mini send and receive serialized, UART-formatted bytes on pins that are not the hardware TX/RX pins. ModbusMaster on the other hand implements the Modbus RTU (binary) protocol on top of that byte stream. In short, the libraries together allow for serial communication using the RS-485 standard using the Modbus protocol. Exactly what we need to communicate with the MTEC-02 sensor.
Then we define the setup() function, which requires two simple functions called preTransmission() and postTransmission() to be defined first.
void preTransmission() {
  digitalWrite(RTS_PIN, HIGH);    // enable driver (transmit)
  delayMicroseconds(200);
}

void postTransmission() {
  delayMicroseconds(200);
  digitalWrite(RTS_PIN, LOW);     // enable receiver
}

void setup() {
  rs485.begin(9600);         // RS485 bus speed (default for MTEC-02A)

  // RTS_PIN pin setup (start in receive mode)
  pinMode(RTS_PIN, OUTPUT);
  digitalWrite(RTS_PIN, LOW);

  modbus.begin(1, rs485);      // Slave ID = 1 (default for sensor)

  modbus.preTransmission(preTransmission);
  modbus.postTransmission(postTransmission);
}
Because the SP3485 is a half-duplex transceiver, we need a way to switch between transmitting and receiving mode. The RTS (Request to Send) pin on the SP3485 is used for this. Putting it HIGH enables transmit, while LOW enables the receiver. This is all the preTransmission() and postTransmission() functions do.
The setup() function starts by initializing SoftwareSerial with a baud rate of 9600, which is the expected value for the MTEC-02A. The RTS_PIN is set as an output pin, meaning we can apply voltage to it which is transferred to the RTS pin on the SP3485. When the pin is set to HIGH it will read roughly 3.3V, LOW is equivalent to 0V. In the setup function the pin is set to LOW (receive) on startup.
Then we do some initialization for the ModbusMaster library. Both the preTransmission() and postTransmission() functions are registered here. The library is now able to call those functions whenever needed automatically. This is very convenient.
After setup, the loop() function starts to run.
void loop() {
  uint8_t result;
  uint16_t reg0, reg1, reg2;

  //Read 3 input registers starting at 0x0000 using function 0x04
  result = modbus.readInputRegisters(0x0000, 3);
  if (result == modbus.ku8MBSuccess) {
    reg0 = modbus.getResponseBuffer(0); // temp
    reg1 = modbus.getResponseBuffer(1); // VWC
    reg2 = modbus.getResponseBuffer(2); // EC

    // Temperature is signed int16 /100
    int16_t tempRaw = (int16_t) reg0;
    float temperature = tempRaw / 100.0;

    float moisture = reg1 / 100.0;    // VWC % (reg / 100)
    uint16_t ec = reg2;               // EC in µS/cm

    String out = "Temperature: ";
    out += String(temperature, 2);
    out += " °C, Moisture: ";
    out += String(moisture, 2);
    out += " %, EC: ";
    out += String(ec);
    out += " uS/cm";

    Serial.println(out);

    // do something with the output?
  } else {
    String error = "Modbus readInputRegisters error: ";
    error += result;
    Serial.print(error);
  }

  delay(50000);
}
As mentioned above when explaining my tests using the USB to RS-485 converter and CuteCom, we need to pass function 0x04 telling the sensor device we want to read input registers. This is exactly what readInputRegisters(0x0000, 3) does. It requests to read 3 input registers starting at address 0x0000.
If the read succeeds, it grabs the three returned 16-bit values from the response buffer:
reg0= temperaturereg1= volumetric water content (VWC)reg2= electrical conductivity (EC)
It formats those into a string and prints it to the serial monitor using Serial.println(out). As explained before, both temperature and VWC need to be divided by 100 to get the correct value.
In this instance, the loop function runs every 50 seconds.
This is all there is to it. Of course, depending on the case you want to do something with the result. I submit the result to my server and store it in my meteodrenthe.nl database.
Initial output
It’s January 2026 now and I’ve been running the sensor since mid-October. Here are some metrics.
- max VWC = 39.9%
- min VWC = 15.47%
- avg VWC = 21.77%
- median VWC = 21.55%
Here is a simple average VWC by date graph.

At the start, VWC was a bit low. This is to be expected as the ground still needs to compact around the sensor and some air pockets remain causing lower readings. A couple of days of significant rainfall starting around October 20th helped.
Here are some more images of the installation back in October.